We’re launching rtcStats, a tool to help you debug, troubleshoot and optimize your WebRTC application – all by processing WebRTC stats.

WebRTC came to our lives when the world shifted from one computing paradigm to another.
We’ve moved away from on premise, bare metal computing, proprietary operating systems and proprietary software to cloud computing, virtualization, Linux/Android and open source. Oh – and the web browser as a leading user interface and our window to the world.
How is that related to WebRTC metrics exactly, and where rtcStats, our newly launched tool, comes in? That’s what I want to discuss here.
Table of contents
You are not in control with WebRTC

Here’s something you need to understand with/about WebRTC:
You are not in control
There are 4 leading actors in WebRTC:
- Your application. You control this part (at least)
- Web browsers. Out of your control in 99% of the use cases. Browsers will update without asking permission from you and they do change their behavior from WebRTC more frequently than other technologies they have
- Network – the internet. Nope. you usually don’t control this piece… the users join from wherever, over the open internet most likely
- The user’s device and peripherals. Users bring their own devices these days (not in all scenarios but in most)
The need to debug and monitor on the edge

So you’re not in control of everything in your WebRTC application. What does that mean?
When a user complains about something in your service. How do you know if the problem is on your end or his?
I remember talking a few years back with an IT manager in one of the large cloud contact center vendors. He said that 90% of all complaints end up being user issues. It might be the network. It might be the headset. It might be the location of the user in his house. It might be a myriad of other problems.
This leaves us with two things we need to figure out:
- Who’s problem is it?
- What can we do to fix it?
If the problem is on the user’s side, then how are you going to even explain it to him and assist him with resolving the issue? Or are you just going to let him stay disgruntled until he churns?
Now, looking only at data in your infrastructure gives you half the picture. What you lack there is an understanding of the real user experience. What happened on the edge, with the device.
When the industry started adopting WebRTC, it also began looking for logs and metrics from the devices to figure out exactly these issues. Since you’re not in control, the most you can do is collect metrics and use them as hints to solve problems users bump into.
Without it? You’re running blind with your service. Good luck with doing this for long.
webrtc-internals’ importance

The main debugging tool we have for WebRTC is webrtc-internals. A kind of an internal Chrome dashboard that collects and displays WebRTC related events and metrics locally inside the browser.
This tool has been and still is the best friend developers have in understanding what is happening with their ongoing WebRTC sessions. While we contributed a lot of improvements over the years (and will continue to do so), webrtc-internals has its own set of drawbacks:
- It is highly technical, useful for the savvy WebRTC developers
- webrtc-internals doesn’t do many computations on its own. Simple things like averaging values or understanding outliers and bad behavior is left to the developer
- When peer connections are closed, they get garbage collected, and all data related to them gets cleared from webrtc-internals
- If you open it after opening a call, you miss a lot of important events that are needed for many debugging sessions
- It is part of Chromium so all changes need to be approved by Googlers. And getting a better graph library is basically impossible!
rtcStats for debugging, troubleshooting and optimizing

The fact that webrtc-internals is a powerful tool, coupled with the drawbacks mentioned above, led me to create along with Philipp Hancke and Olivier Anguenot a new tool called rtcStats.
It doesn’t replace any of the existing tools you know out there – free or commercial.
It brings something else, new and fresh into the market.
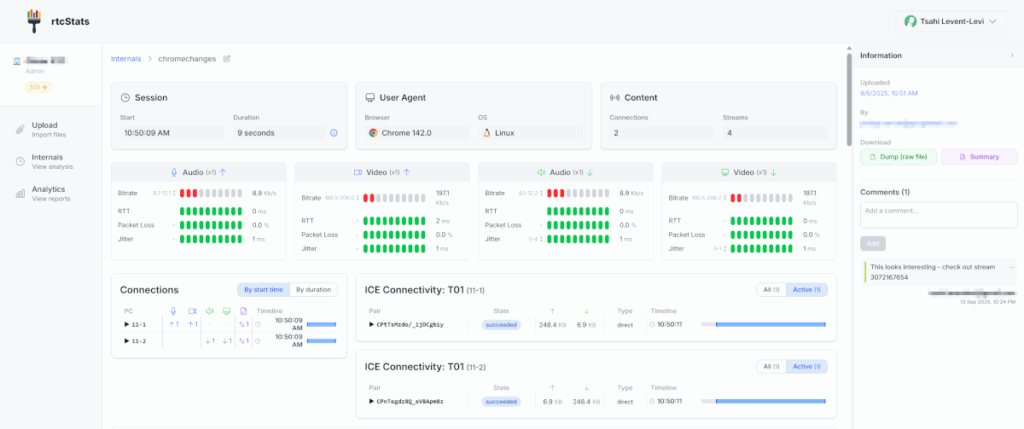
What we’ve done is take everything found in webrtc-internals, making it stupidly easy to view the data in ways that aren’t available anywhere else.
Think of it as webrtc-internals on steroids.
When you want to look at a webrtc-internals dump file to debug, troubleshoot or even optimize something you’re working on, then you can now just upload it to rtcStats and view it there. Oh, and did I mention you can also share it with others without emailing it to them? And leave comments on it while at it.
You’ll be amazed at how much faster your debugging sessions are going to be from now on.
The best thing? We’ve got a free tier for this tool that is quite useful. Just sign up and upload your first dump file.
👉 Need better ways to review and understand webrtc-internals information when you debug and develop? Use rtcstats.com.
rtcStats for continuous monitoring

There’s another thing you can do with rtcStats, and that’s view rtcstats files. These files are generated by the popular rtcstats SDK. It was traveling between github users and now has a permanent home in our rtcstats account there.
We’ve modernized the code and made it work better than the old rtcstats SDK, which was initially written almost a decade ago and started to show its age. The approach used has stayed relevant over the years and we have refined it a bit, such as significantly reducing the amount of data that is uploaded. Another thing we did was switch to a monorepo approach, where the project on github now has both the rtcstats client SDK as well as rtcstats-server.
The end result?
You can integrate rtcstats client SDK directly with your web application. It will automatically collect and pass the metrics to the rtcstats-server that you can install and host wherever you want.
From there, you can pass the data into your own database (we’re not going to handle long term storage or aggregation analysis – there are enough BI and monitoring tools for that). You can also pass rtcstats files directly from the server to our rtcStats website. The result?
- Have the data readily available in rtcStats for analysis
- When you upload the files to us, we send back a compact JSON object with all the aggregate top level data and observations we find. You can store this in your database and run trends analysis on it
👉 Want to own your data while enjoying the best debugging capabilities for WebRTC? Use rtcstats-server and pass your data to rtcstats.com for viewing purposes
From statistics to Observations

We’ve just launched rtcStats. There’s a ton we’re going to add here. One of the main things is the way we think about WebRTC statistics. We had quite a few discussions and brainstorming sessions until we got to this point:
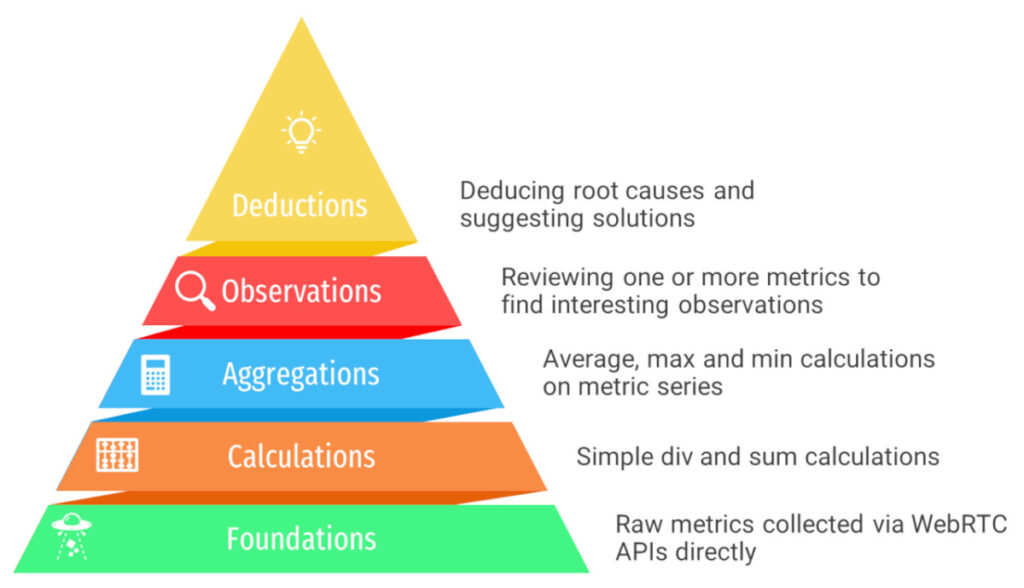
What we’re releasing today is the part of rtcStats that covers Foundations, Calculations and Aggregations. We are experimenting a bit with the Observations layer, which is where our focus lies in the next upcoming releases.
We plan on releasing rapidly and frequently, using the time between releases to listen to our users and improve the experience.
The Observations layer and the Deductions layer are going to be part of the paid platform and not part of the free platform (we need to eat).
With the Observations, we’re pouring the best practices and knowhow we have about WebRTC between the three of us, turning it into gold for you to immediately find once you view your WebRTC data. Think of it as your personal WebRTC expert, sitting there next to you, guiding you through the process.
Deductions? That’s what we will tackle once we nail the Observations experience.
What should you do?
Head on to rtcstats.com. Create an account. Upload a dump file. Play with it. Send us feedback.
If you’re working on continuous monitoring, then also be sure to check out and integrate with our rtcstats github repo.
And if you want to talk, you know where and how to find me 😉