WebRTC monitoring the right way.
When we started out developing testRTC, what we had in mind is a service that helps QA people test their service prior to heading to production. We’ve built a sleek webapp that enables us to simulate virtually any type of a WebRTC use case. Testers can then just specify or record their script and from there run it and scale it in their tests using testRTC. What we quickly found out was that some were looking for a solution that helps them monitor their service as opposed to manually (or even automatically and continuously) testing their latest build.
The request we got was something like this: “can you make this test we just defined run periodically? Every few minutes maybe? Oh – and if something goes awfully wrong – can you send me an alert about it?”
What some realized before we did was that the tests they were defining can easily be used to monitor their production service. There reasoning behind this request is that there’s no easy way to run an end-to-end monitor on a WebRTC service.
The alternatives we’ve seen out there?
- Pray that it works, and wait for a user to complain
- Using Pingdom to check that the domain is up and running and that the server is alive
- Using New Relic or its poor man’s alternative – Nagios – to handle application monitoring. It boils down to testing that the servers are up and running, CPU and memory load look reasonable and maybe a bit of your server’s metrics
But does that mean the service is up and running, or just that the machines and maybe even processes are there? In many cases, what IT people are really looking to monitor is the service itself – they want to make sure that if a call is made via WebRTC – it actually gets through – and media is sent and received – with a certain expected quality. And that’s where most monitoring tools break down and fail to deliver.
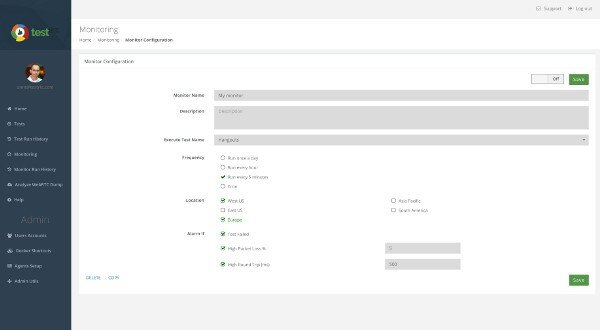
This is why a few weeks ago, we’ve decided to add WebRTC monitoring capabilities to testRTC. As a user, you can set it up by defining a test case, indicate from where in the world you want it to run, define the intervals to run it along with thresholds on quality. And that’s it.
What you’ll get is a continuously running test that will know when to alert you on issues AND collect all of the reports. For all calls. The bad ones and the good ones. So you can drill down in post mortem to see what went wrong and why.
If you need something like this, contact us on testRTC – the team would love to show you around our tool and set you up with a WebRTC monitor of your own.
Sorry if this sounds a bit like a rant or complaint, but I always see incomplete lists of what types of monitoring exist. Monitoring applies to pretty much every application you put on the Internet. It’s really useful to know all the options before you decide what is most important for your application. And you should deploy as many of them as is possible within time and budget.
You might not enable all alerting at first, but it’s smart to collect as much of the information as possible. Then hopefully you have the needed information to look at if someone complains and you can see what is going wrong.
Hopefully these give you ideas what else to do (better):
– Real User Monitoring and other information from the browser -> sent stats to the server about what is happening in at the client. Maybe even save them to localStorage in case they can’t be sent. Seen them too for WebRTC.
– logging from the application -> alerting on certain messages. Logging is very useful in case of looking for the cause of problems. Obviously your application needs to give warnings and maybe some debug information (a debug mode is also really useful).
– passive monitoring: stats of use, performance stats (memory usage, cpu usage, etc.). Alerting of extremely low number of users, larger than usual percentage of slow responses (possibly 95 percentile). And ‘instrumenting the code’. Think of things like statsd as well. This is the bucket most of what New Relic does fits in.
– active monitoring: pingdom and Nagios are in the same category here. And where testRTC fits in I guess. You want it both of the servers (even if just ping, TCP-connect, etc.) and the service (don’t forget monitoring DNS).
Also you can also built in automatic response. If you have a process running on a server and it fails in some way you can use some method to automatically start it again.
Failure in this case can be: ‘passive’ monitoring: the process has stopped running, or active monitoring: send requests and get the right response. The passive kind are node.js forever/daemontools/runit/systemd/Windows Services automatic restart facility. A tool like Monit fits both in the active and passive type category.
Hope this was helpful.