Maximize your understanding of webrtc stats and webrtc-internals, assisting you in monitoring and analyzing WebRTC applications.

WebRTC is great. When it works.
When it doesn’t? A bit less so. Which is why there are tools available at your disposal to be able to debug and troubleshoot issues with your WebRTC application – be it connectivity failures, poor quality, bad use of the APIs or just buggy implementation.
This article, as well as the other articles in this series were written with the assistance of Philipp Hancke.
See also: Automatically collecting webrtc-internals with rtcstats
Interested in webrtc-internals and getStats? Then this series of articles is just for you:
- webrtc-internals and getStats (you are here)
- Reading getStats in WebRTC
- ICE candidates and active connections in WebRTC
- WebRTC API and events trace
- Tools for troubleshooting WebRTC applications
This time? We’re focusing on WebRTC debugging 101. Or as it is more widely known by: webrtc-internals and getStats
Table of contents
A quick introduction to getStats

WebRTC runs inside the browser. It has a set of Javascript APIs so developers can build their applications using it. The thing is, that networks are finicky and messy – they are unpredictable. Which is why developers need to monitor quality metrics. If you don’t do that in your application, then:
- Customers might complain (poor resolution; video freezes; echo; etc) – and you will have nothing to say to them about that. It is not as simple as “your network sucks” anymore and the cost of refunding them for everything is going to affect your revenue
- Your application might not be properly fine tuned and optimized for the scenario you’re using (you can call it bugs)
What is needed is observability, and that is done using an API that was available in WebRTC since its inception – known as getStats(). getStats exposes a surprisingly large amount of information about the internal performance of the underlying WebRTC library.
Calling getStats
getStats can either be called on the RTCPeerConnection object or specific senders or receivers. Since calling it on senders or receivers only filters the result obtained for the whole connection it is typically better to call it on the RTCPeerConnection:
const stats = await pc.getStats();
Remember that getStats is an asynchronous method so returns a Promise which needs to be awaited. The Promise resolves with a “Maplike” object that is a key-value store in Javascript.
You can iterate over this with a for-loop and log the contents:
stats.forEach(report => console.log(report.id, report))
Please note that the “id” is an identifier and while it has a certain structure in Chrome, do not attach any meaning to that structure as it is subject to change without notice (this happened in the past already)..
Alternatively you can get an array with the values which is useful if you are looking to filter for certain types of reports:
[...stats.values()].filter(report => report.type === 'inbound-rtp')
The key of each key-value pair is a string that uniquely identifies the object and is consistent across calls. This means you can call getStats at two different points in time and compare the objects easily:
// we assume `stats` has been obtained “a while ago”

const newStats = await pc.getStats();
Assuming we are interested in the audio bitrate, we would look for the “outbound-rtp” report with an “audio” kind:
// we assume `stats` has been obtained “a while ago”

const newStats = await pc.getStats();
We need to check that “currentAudio” exists and that stats.has(currentAudio.id) (i.e. the old report has the same value and then we can calculate the audio bitrate from the “bytesSent” values as
// check currentAudio and stats.has(currentAudio.id)
audioBitrate = 8 * (currentAudio.bytesSent - stats.get(currentAudio.id).bytesSent) / (currentAudio.timestamp - stats.get(currentAudio.id).timestamp)
The pattern of taking the difference in the cumulative measure and dividing it by the time difference is very common, see here for the underlying design principle.
What do the values inside getStats exactly mean? That’s what we’re covering in our reading getStats article.
getStats frequency

At what frequency should you be calling getStats()?
That’s up to you. For most metrics, calling it at frequencies lower than a second makes no sense. And frequencies above 10 seconds will be too little usually.
getStats() uses a JavaScript Promise – which means it is asynchronous in nature. You ask for stats and then the browser (WebRTC) will be working to get the stats for you. It will return the Promise once done.
Calling too frequently means eating up CPU for collecting statistics since getStats needs to query a lot of information from different parts of the system. If you don’t plan on using it for something important enough at such a frequency, then call the function less frequently.
One example of using getStats for the wrong task was calling it several times per second to get and display the audio level. This has since been replaced by a better API and getStats is returning the same result when it is called too frequently.
getStats returns aggregated values for many statistics such as the number of bytes received. This lets you call getStats and subtract the previous value from the current value and divide this by the time between the two measurements to get an average over a time period.
Our suggestion? Once a second. For statistics that are a bit jittery keep a 3-5 second old object around and average over the slightly larger window.
Reading getStats results
How to read getStats results is a bigger topic and won’t fit here. Lucky for you, we’ve written a dedicated article just for this!
Head on and check out how to make sense of getStats results.
Why collect stats from the client anyway
In the past, in VoIP services, we often focused on collecting the metrics and statistics from the “network”. We collected the metrics from the media servers and other application servers. We also placed network packet analyzers near the media servers to measure these metrics for us.
This cannot be done anymore…
- WebRTC enables also peer to peer interactions, so the media doesn’t even flow to the servers, which means that the infrastructure has no clue about the session quality for peer to peer sessions
- WebRTC encrypts all media traffic using SRTP. Encrypted traffic means a lot less visibility for packet inspection tools, which means that even metrics going to our backend is mostly “invisible” to us
- Collecting from the media servers means we know what they “feel” about this session, but what we are really interested in is what the devices/users “feel” about this session. Many of the metrics available on the client just don’t exist on the other end of the session
When WebRTC was introduced, it immediately lent itself to client side metrics collection. The bandwidth available to us was higher than ever before for the most part, many of the developers building WebRTC services were never indoctrinated as VoIP experts – they were just web developers. This meant that client side collection of stats was adopted and made common.
Whatever the reason is, today’s best practice is to collect the information from the client itself, and that makes total sense for WebRTC applications.
A word about rtcstats
A decade ago Philipp Hancke created an open source project years ago called rtcstats. It is a very lightweight approach to wrap the underlying RTCPeerConnection object, periodically call getStats and send the statistics (as well as other information about the API calls) to a server. On the server one of the artifacts this produces is a “dump” with information equivalent to the webrtc-internals dump. While it has not been updated recently, there are friendly forks e.g. from Jitsi. This project enables us to easily collect WebRTC related information from a WebRTC application without much integration effort. The library itself is simple enough that it does not require much maintenance or frequent updates.
If you are looking to build your own WebRTC statistics collection for your WebRTC application, then this project is highly recommended.
rtcstats collects everything – API calls and all getStats metrics, sending it to the server side of your data collection. It does so with some thoughts about reducing the traffic on the network by implementing a kind of a virtual sparse graph of the metrics collected (think of it as not collecting metric values that haven’t changed). This avoids stealing away the bandwidth needed for real time communications for uploading the logs.
Chrome and webrtc-internals

In a way, Chrome was always at the forefront of WebRTC (not surprising considering ALL modern browsers end up using Google’s libWebRTC implementation). They were the first to implement and adopt it into their browser and services as well (obviously).
What happened is that Google needed simple tooling to debug and troubleshoot issues related to WebRTC. So they created webrtc-internals.
What is webrtc-internals?
webrtc-internals is a browser tab (just write chrome://webrtc-internals in the address bar of your Chrome browser) that collects and shares WebRTC related information from the browser itself.
It has information about GetUserMedia, PeerConnection configuration, WebRTC API calls and events and calls to getStats – both latest and visualized on graphs.
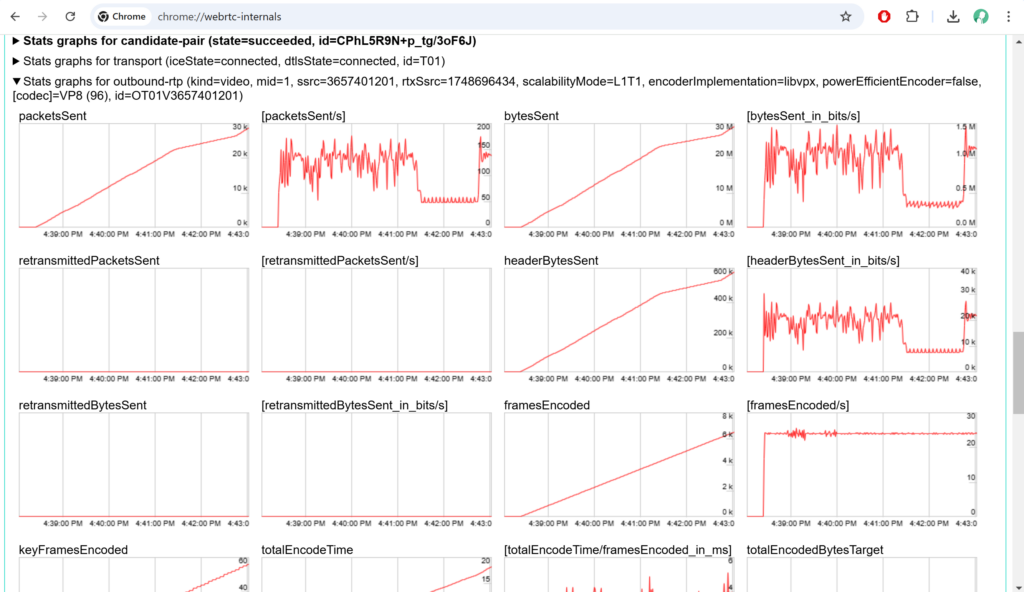
This treasure trove of information is quite handy when you’re trying to figure out what’s going on with your WebRTC application.
The challenge? The data itself is transient. There as long as the peer connection is open. Deleted and gone the moment it is closed.
This leaves us with two big challenges:
- How do developers review webrtc-internals of users who complain? They can’t really open that on the user’s machine remotely
- The data is available only during the session itself. How do you get to that data after the fact?
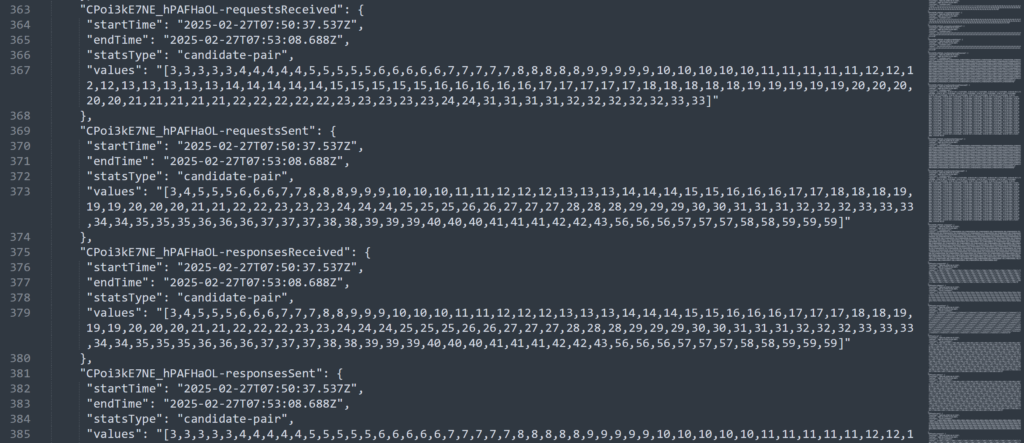
How to obtain a webrtc-internals file?
The first thing we need in order to “solve” the two challenges above is to “convert” webrtc-internals into a file (also know as a webrtc-internals dump)
The video above explains that visually. In essence:
- Open chrome://webrtc-internals. Preferably, before starting to run the session at all
- Keep it open and run your service – without closing the WebRTC session
- Go back to the chrome://webrtc-internals tab, click on Create a WebRTC-Internals dump
- Click the Download the “webrtc-internals dump” button
You should now have a webrtc_internals_dump.txt file in your downloads folder.
Note that you still need to be purposeful about it, planning on obtaining that information to begin with, and actively downloading the file. Not fun, but very useful.
Reading webrtc-internals

How to read getStats results is a bigger topic and won’t fit here. Lucky for you, we’ve written a dedicated article just for this!
Head on and check out how to make sense of getStats results.
webrtc-internals alternative in Firefox
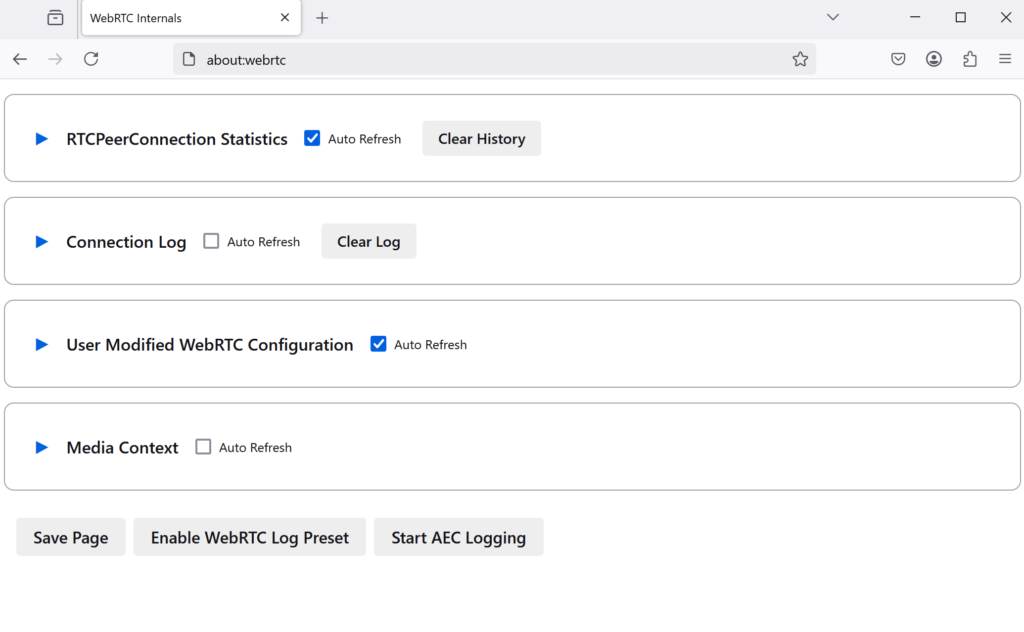
Mozilla has its own about:webrtc browser tab for Firefox.
They even outdid Google here and actually wrote about it: Debugging with about:webrtc in Firefox, Getting Data Out
What they are lacking though is relevance… not many developers (or users) are using Firefox, so the whole focus and effort is elsewhere.
Here’s the thing – at the end of the day, what we need is a robust solution/service across all browsers and devices. This usually translates to rtcstats based solutions. More on that… in a later article in this series.
👉 Still interested in debugging on Firefox? Check out this section from Olivier’s post on debugging WebRTC in browsers
webrtc-internals alternative in Safari

Debugging is Safari is close to nonexistent. You’d be better off collecting the data yourself via rtcstats.
Apple, being Apple, doesn’t care much about WebRTC or developers in general.
👉 Still interested in debugging on Safari? Check out this section from Olivier’s post on debugging WebRTC in browsers
Visualising WebRTC statistics

Having stats is great, but what do you make out of this?
Being able to see anything here is hard. The best solution out there is rtcstats.com – hands down, this is the best visualizer you can find around – the tool has a free plan and the paid tiers include features such as an experience score, observations and AI summaries.
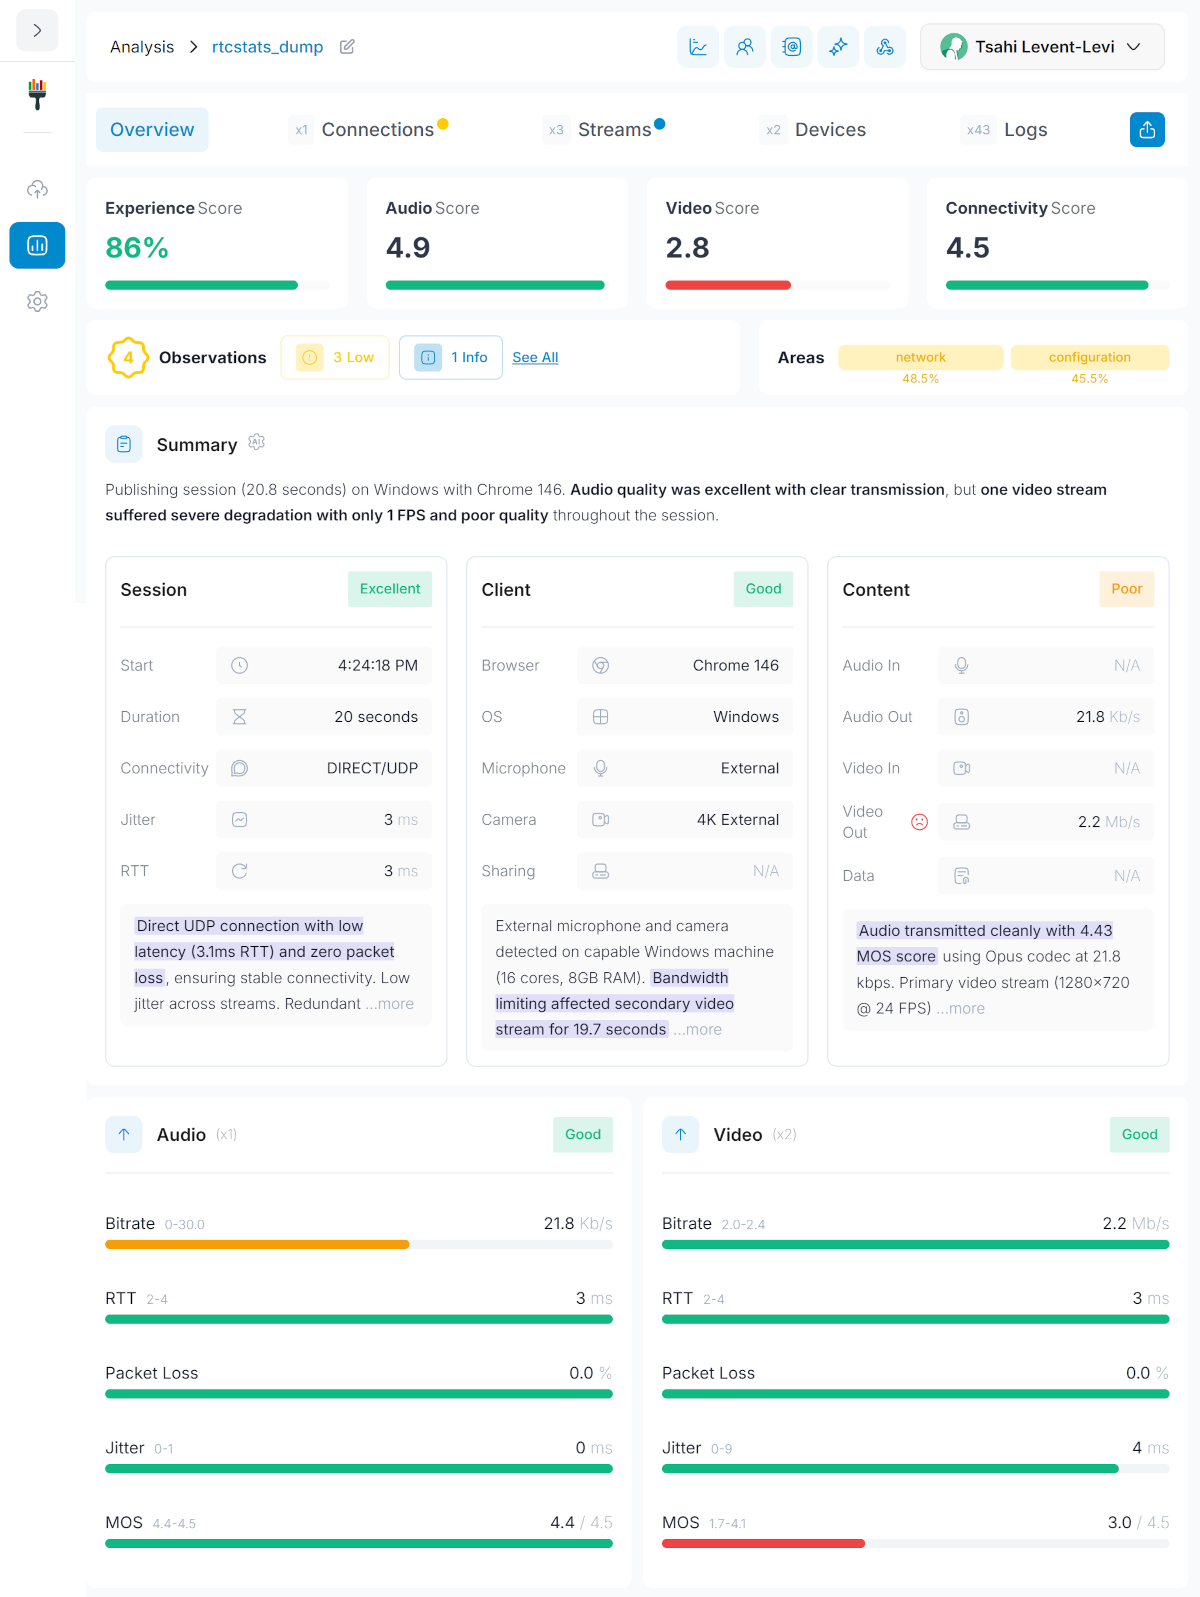
Did I mention I am one of the people behind rtcstats.com? Call me biased, but do check it out 😉
How can we help

WebRTC statistics is an important part of developing and maintaining WebRTC applications. We’re here to help.
You can check out my products and services on the menu at the top of this page.
The two immediate services that come to mind?
- WebRTC Courses – looking to upskill yourself or your team with WebRTC knowledge and experience? You’ll find no better place than my WebRTC training courses. So go check them out
- WebRTC Insights – once in every two weeks we send out a newsletter to our Insights subscribers with everything they need to know about WebRTC. This includes things like important bugs found (and fixed?) in browsers. This has been a lifesaver more than once to our subscribers
- rtcStats – reduce your troubleshooting and debugging from hours to minutes and get a WebRTC observability platform while owning your data
Something else is bugging you with WebRTC? Just reach out to me.