Understand WebRTC active connection and how to troubleshoot connectivity issues effectively in your WebRTC applications.
WebRTC is great. When it works.
When it doesn’t? A bit less so. Which is why there are tools available at your disposal to be able to debug and troubleshoot issues with your WebRTC application – be it connectivity failures, poor quality, bad use of the APIs or just buggy implementation.
This article, as well as the other articles in this series were written with the assistance of Philipp Hancke.
Interested in webrtc-internals and getStats? Then this series of articles is just for you:
- webrtc-internals and getStats
- Reading getStats in WebRTC
- ICE candidates and active connections in WebRTC (you are here)
- WebRTC API and events trace
- Tools for troubleshooting WebRTC applications
This time? We’re going to figure out ICE negotiation and active connections. Let’s start…
Table of contents
WebRTC Peer Connections – a quick look
Watch the video above if you’re unfamiliar with how WebRTC works. It shows two aspects of WebRTC:
- Signaling, which is out of scope of WebRTC
- Media, which presumably goes peer to peer – directly between the browsers
Here’s the thing though: media might not go directly between browsers. Or even from a browser to a media server. The reason for that is the network. At times, networks are going to block our traffic:
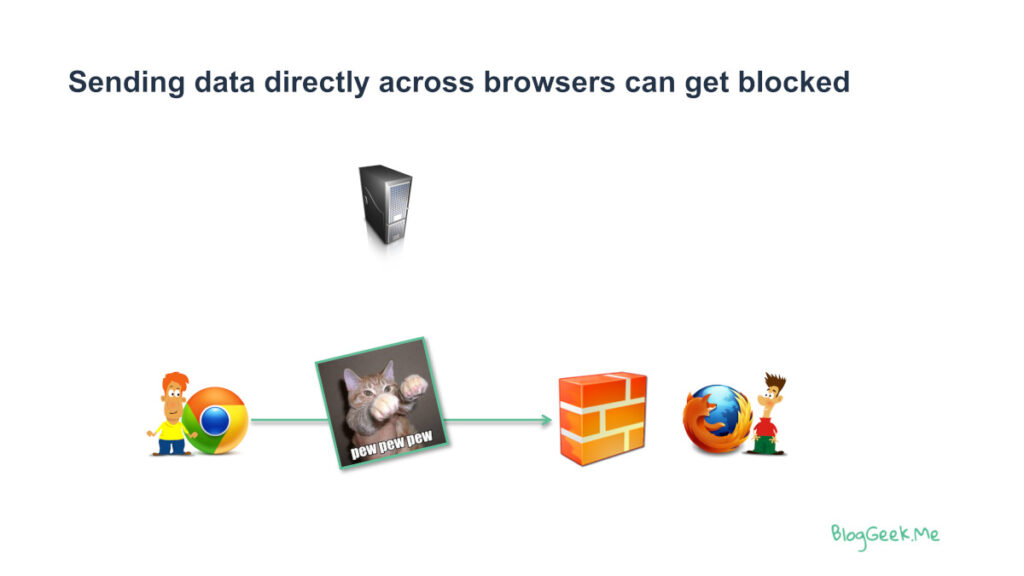
To overcome this, we use a protocol called ICE in WebRTC.
Reading WebRTC ICE related events – the video version
The video above is a visual explainer of what we have in this article (to some extent). Use it as an introduction before going into the details below.
Understanding ICE negotiation in WebRTC
Here’s a quick overview of ICE:
WebRTC uses ICE to handle NAT traversal.
ICE collects different addresses that the device can use – the local device IP addresses, its public IP addresses (obtained by using a STUN server) and any relay IP addresses (obtained by using TURN servers).
- Each such address is called an ICE candidate pair
- There are local candidates – the addresses of the local device
- And there are remote candidates – the addresses of the remote device (be it another browser, device or media server)
In WebRTC, we prefer using a method called Trickle ICE, which collects the addresses and runs connectivity checks with addresses it already has in parallel.
Each pair of local and remote candidates is used to conduct a connectivity check.
Once such a check succeeds, we reach the connected state and can start sending media.
If more connections of such pairs are made, the pair with the highest priority will be used.
This process takes time and resources. The results of which aren’t as deterministic as we’d like it to be either. And at times – you can’t really connect, or you end up connecting in ways that make little sense (usually because of your own bugs).
Why is this important to us when we talk about getStats and webrtc-internals?
Because A LOT of the issues we will face with WebRTC are going to revolve around connectivity of the session. And that boils down to understanding ICE negotiation, selected candidate pair and the active connection in many of the cases.
👉 read this quick article about STUN, TURN and ICE for a few more aspects of NAT traversal
ICE candidates and ICE candidate pairs

We’ve seen how ICE candidates and ICE candidate pairs look like in getStats() last time.
Lucky for us, WebRTC makes it a bit easier to see these things when you open the webrtc-internals tab in Chrome.
For me, there are 4 different places to look for when it comes to connectivity and ICE negotiation in WebRTC:
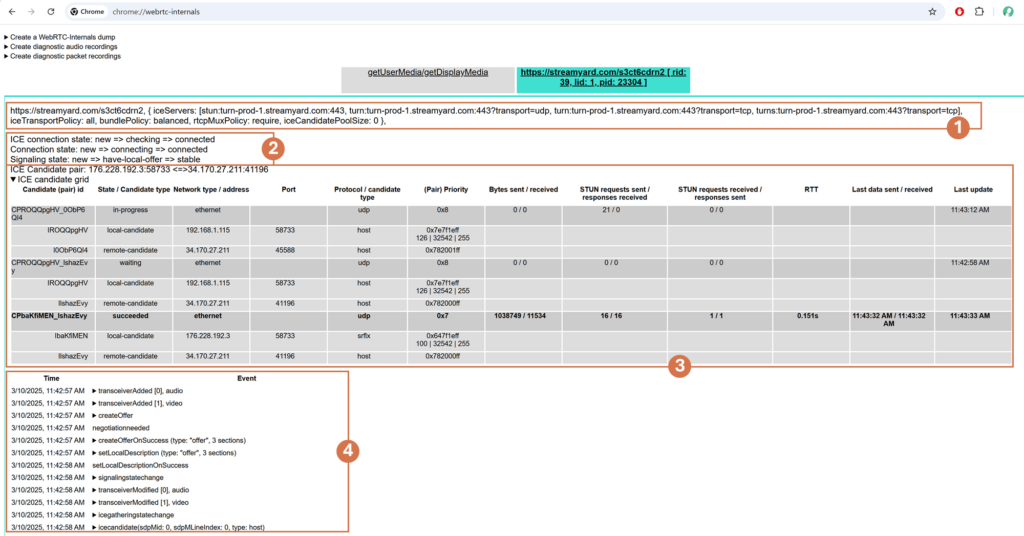
- Peer connection configuration
- State machines
- ICE candidates table
- Events log
1. Peer connection configuration
The peer connection configuration shows us the configuration of the peer connection.
The important parts here are wrt connectivity? The iceServers and the iceTransportPolicy (see here for the “official” documentation).
If the iceTransportPolicy is “relay” then we know we will end up connecting via TURN.
The iceServers configuration simply tells us which STUN and TURN servers are going to be approached when collecting IP addresses for local ICE candidates.
2. State machines
The state machines indicate which states we’ve gone through.
More on that in the next section.
3. ICE candidates grid
The ICE candidates table is a representation of “candidate-pair”, “local-candidate” and “remote-candidate” from getStats().
Each 3 rows in this grid represents an ICE candidate pair and the following two lines represent the local and remote candidates.
4. Events log
The events log isn’t specific to the ICE connectivity process itself, but rather stores more information in it. More on that in the next article of this series.
There are events in there that relate to ICE connectivity, which is why we mention it here.
What are we interested in?
- createOffer & createOfferOnSuccess or createAnswer & createAnswerOnSuccess
- setLocalDescription and setRemoteDescription
- addicecandidate
- icecandidate
- icegatheringstatechange
- iceconnectionstatechange
State changes in ICE

Out of the state machines available, the iceConnectionState is the most interesting (and complex).

How do we follow the ICE connection state? By implementing the oniceconnectionstatechange event (see here) and checking what you receive there.
In webrtc-internals? That’s part of the events log.
Our objective? In a normal session, that would be to reach the connected state and stay there for the duration of the session. If this isn’t the case, then it will be time to drill down and figure out the issues.
👉 If you are enrolled in our WebRTC: the missing codelab course, then you can learn more about this state machine and how it behaves under certain conditions (=debugging issues) in the Connection states lesson.
Finding the active connection from webrtc-internals

Out of all the ICE candidate pairs we may have one or more active connections. Why more than one? Because the active one might have disconnected or a better connection was found (better in terms of priority).
Knowing which one is active helps us understand quite a few things about our connection:
- Is it direct or relay (via TURN)?
- Are we sending data over UDP, TCP or TLS? (and yes, we want UDP)?
- What type of network we’re on (works in Chrome and tells us if this is Ethernet, WiFi or Cellular)?
- The RTT on the connection to the STUN/TURN server
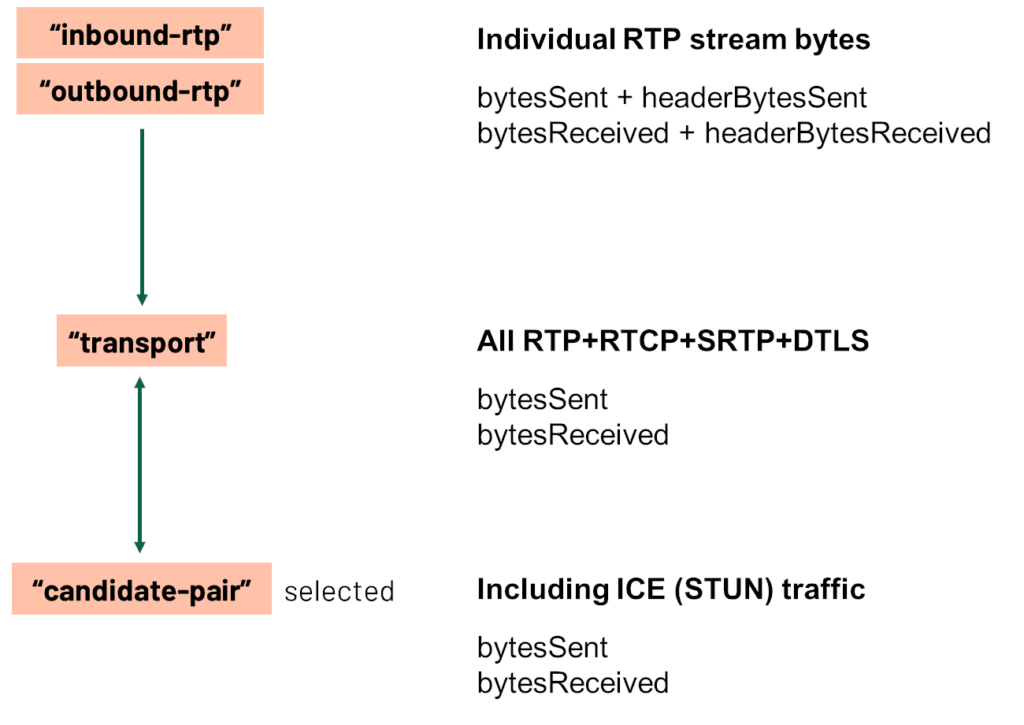
- The amount of bytes sent and received on this connection (gross and not specific to a certain media payload)
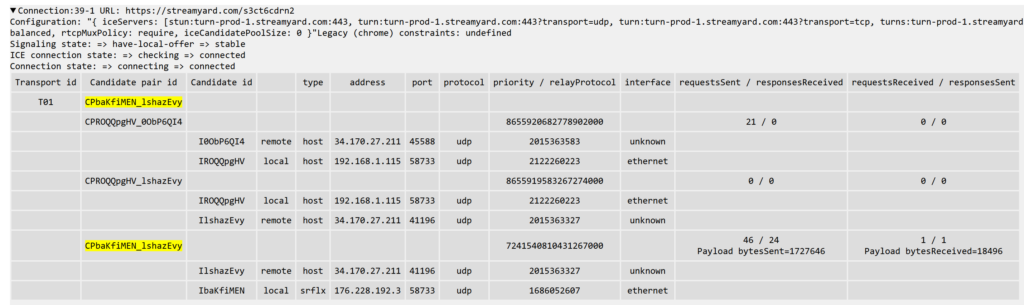
webrtc-internals makes it easy to know which of the ICE candidate pairs is the active connection – it is simply the one marked in bold:
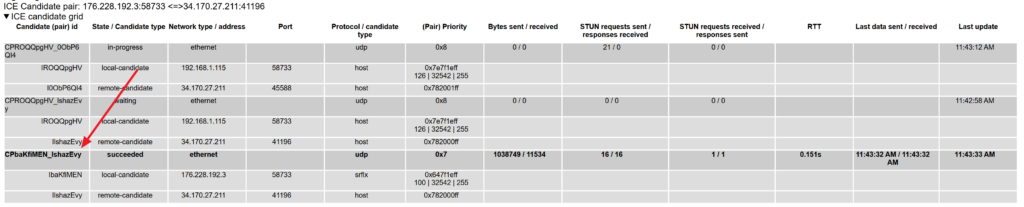
If you are using the dump importer, then at the top of the table there’s a row with a single value, which is the ID of the active connection – just search for it and you shall find:
Finding the active connection via getStats

Having this type of information in getStats() also means we can figure it out programmatically in runtime during the session itself.
Here’s how we go about doing it:
First we acquire a statistics object from the RTCPeerConnection:
const stats = await pc.getStats();
console.log(stats, [...stats.values()]);
This is an asynchronous call so we need to use `await.`
Next, we find the first (and typically only) object with type `transport`. If you have more than a single transport because you are not using BUNDLE, make it to adapt your code accordingly – in that case there is no single “active” connection.
const transportStats = [...stats.values()].find(report => report.type === ‘transport’);<br>console.log(transportStats);
Make sure to check that this is not undefined.
👉 Note: As of March 2025 Firefox still lacks those statistics so workarounds have been required since 2018, see the WebRTC samples repository.
The transport should typically have a `selectedCandidatePairId` property. This can be undefined when a connection has not been negotiated or settled on a candidate pair yet.
The selectedCandidatePairId is a pointer to the ‘candidate-pair’ object that has more information about the current candidate pair. You can access it like this:
const candidatePairStats = stats.get(transportStats.getSelectedCandidatePairId);<br>console.log(candidatePairStats);
That candidate pair already gives you some information such as the number of packets sent and received on it. This typically includes audio, video and datachannel packets but does not include STUN packets whose traffic is accounted for on the transport statistics (or should be, there is a pending specification issue).
The candidate pair lets you access the local and remote candidate statistics for the candidates it is formed from via the `localCandidateId`and `remoteCandidateId`properties:
const remoteCandidateStats = stats.get(candidatePairStats.remoteCandidateId);
console.log(remoteCandidateStats);
From the remote candidate stats you might be interested in the `candidateType` property to determine if the remote end is using a TURN server.
The local candidate statistics contain a bit more information about where the candidate was gathered from, in particular from which of the configured ICE servers it was gathered:
const localCandidateStats = stats.get(candidatePairStats.localCandidateId);
console.log(localCandidateStats, localCandidateStats.candidateType, localCandidateType.relayProtocol, localCandidateStats.url);
That is a lot of information you can pull out about the active connection on top of which your WebRTC connection runs. You can even implement the ICE candidate grid you see in WebRTC-internals using it! But if you just want to get started we recommend doing so with the WebRTC sample as a reference.
How can we help

WebRTC statistics is an important part of developing and maintaining WebRTC applications. We’re here to help.
You can check out my products and services on the menu at the top of this page.
The two immediate services that come to mind?
- WebRTC Courses – looking to upskill yourself or your team with WebRTC knowledge and experience? You’ll find no better place than my WebRTC training courses. So go check them out
- WebRTC Insights – once in every two weeks we send out a newsletter to our Insights subscribers with everything they need to know about WebRTC. This includes things like important bugs found (and fixed?) in browsers. This has been a lifesaver more than once to our subscribers
Something else is bugging you with WebRTC? Just reach out to me.