Explore the WebRTC API trace for effective debugging and troubleshooting of connectivity and quality issues in your applications.

WebRTC is great. When it works.
When it doesn’t? A bit less so. Which is why there are tools available at your disposal to be able to debug and troubleshoot issues with your WebRTC application – be it connectivity failures, poor quality, bad use of the APIs or just buggy implementation.
This article, as well as the other articles in this series were written with the assistance of Philipp Hancke.
Interested in webrtc-internals and getStats? Then this series of articles is just for you:
- webrtc-internals and getStats
- Reading getStats in WebRTC
- ICE candidates and active connections in WebRTC
- WebRTC API and events trace (you are here)
- Tools for troubleshooting WebRTC applications
What did your app do exactly? That’s going to be what we’ll look at and cover now. The events log that holds all WebRTC API calls.
Table of contents
WebRTC events log – the video version
Here’s a quick video guide on the WebRTC events log:
What is in the events log?

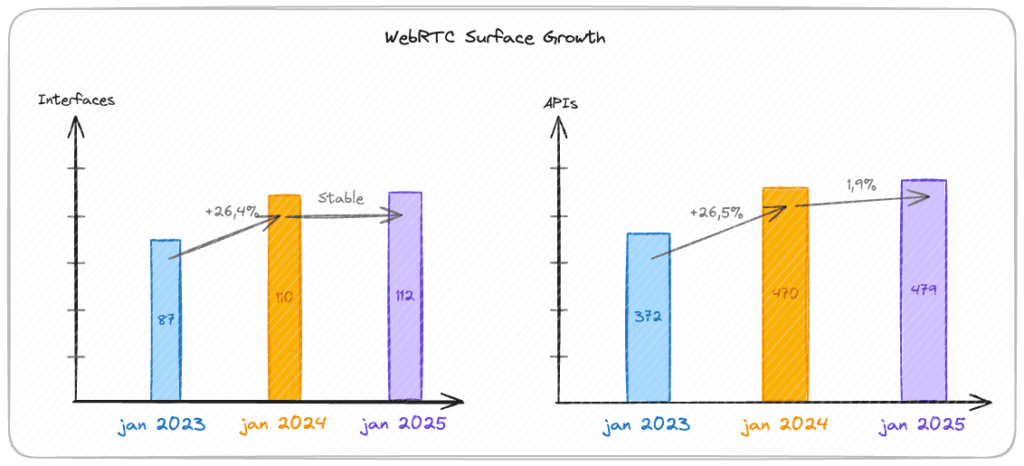
WebRTC has a rich set of APIs in web browsers for using it. “Stealing” from Olivier’s article about the state of WebRTC APIs, there are currently 479 APIs in WebRTC:
When an issue arises in a WebRTC application, it might be due to a multitude of reasons – from network, to device, signaling, the user, etc.
It might be connectivity and media quality. But also just unexpected behavior of the application.
One of the ways in which we can debug things (without breakpoints and runtime debuggers) is by looking at the WebRTC events log (also known as events trace at times).
If you open chrome://webrtc-internals as a destination inside a Chrome browser tab, it will collect WebRTC API calls and events from all of your Chrome browser tabs and log them into this new tab. You will then be able to review the flow of your WebRTC application – the APIs it called at each step, the return values of failures, events that were invoked, etc.
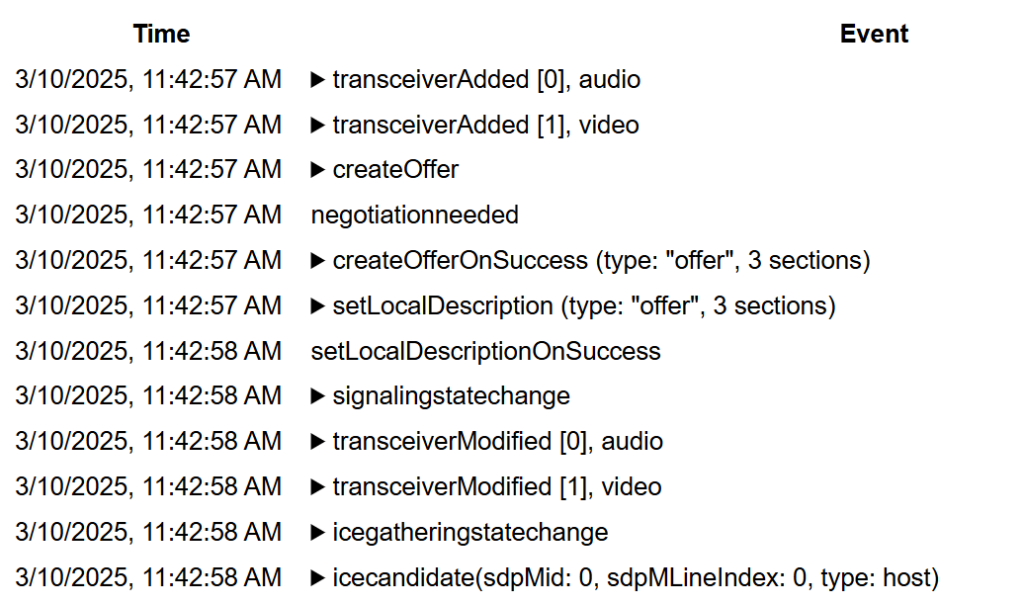
Here’s how it looks like when using StreamYard (to make the video recorded above) for example:
When more data is there, you can click to open up, showing for example, the SDP of the createOfferOnSuccess() event.
A very similar events log exists in the dump importer as well, so we’ve skipped showing a similar screenshot for it.
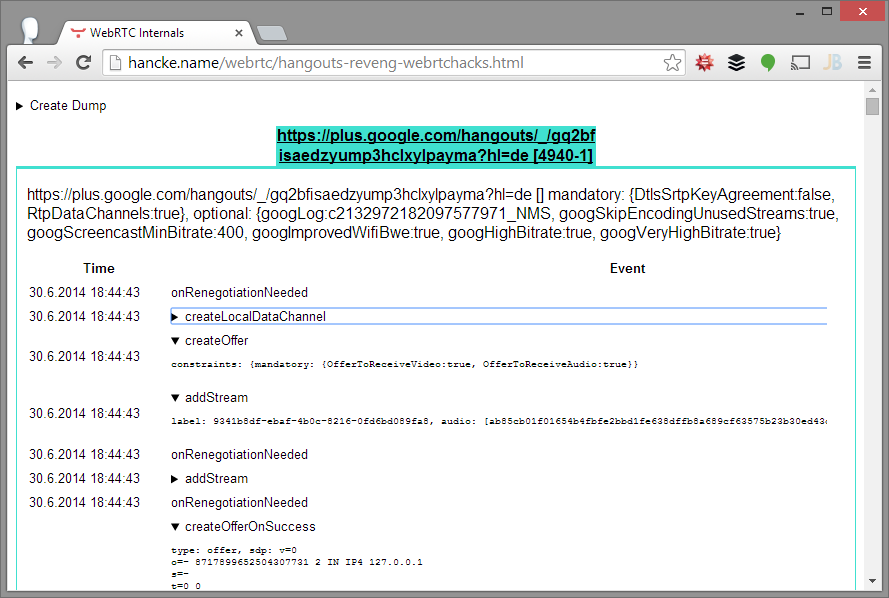
Under the hood this functionality is implemented outside of libWebRTC in the Chromium layer (which is the reason this is not easy to replicate for other browsers). The implementation (called the “peer connection tracker”) is monitoring all RTCPeerConnection objects and getting notified about all method calls and events. This information gets serialized to JSON and is sent to the webrtc-internals tab(s) (if they are open) and then turned into the event log we can see in the screenshot. While it has evolved quite a bit compared to how it looked like in 2014 in one of Philipp’s first WebRTCHacks posts, the basic functionality has been there for over a decade and helped resolved countless bugs and issues:
How to create traces of your own programmatically?

webrtc-internals has in many ways shaped the approach WebRTC developers take to debugging WebRTC issues. It has a very serious shortcoming though, you can not ask a user to send you a “webrtc-internals dump” that lets you look at their problem. As we have seen countless times, that is challenging even for developers.
You can take the same approach as Chromium and add tracing before and after each method call and for each event. That becomes quite a maintenance hassle however. In Javascript, one can use the same polyfilling techniques used by adapter.js to achieve the same result transparently with a polyfill. This is how “rtcstats.js” came to be and it is surprisingly compact, only 400 lines. These days, Jitsi is maintaining a fork.
The main advantage of this is that it is very lightweight on the client side, limiting itself to the traces and periodic collection of data while all the business logic is handled by a backend. Even without a backend the events and stats can be stored on the clients’ browsers in a storage such as IndexedDB and then attached to support requests.
Important APIs and callbacks in the events log

The events log has quite a few of the APIs and events that occur in a WebRTC application. Here’s our approach to sifting through it quickly.
The connection failed
We start with a verbal description of the problem, e.g. “the connection failed”.
For this we are going to look at the TURN servers configured, the candidates gathered via `onicecandidate` and the candidates added via `addIceCandidate` as well as the `iceconnectionstatechange` events:
- Did the call fail to connect at all or did it fail at some point?
- What happened prior to that point?
- In particular the iceconnectionstatechange is such a frequent issue that the dump importer marks it a failure in bright red so you can see it immediately
There was no audio
Another example would be “there was no audio”.
We saw such an issue recently so the first thing we checked was whether an audio track was emitted via a ‘transceiverAdded’ event. This was the case, with both an audio and a video track. We then checked the statistics of the audio track and noticed that while `packetsReceived` increased so did `packetsDiscarded`. The jitter buffer emitted events but audio level was consistently zero which pointed to audio not being decoded. Going back to the `transceiverAdded` events for audio and video they showed different streams being used.
The bug? The ‘ontrack’ handler in Javascript was setting the srcObject of the video element used to the track event stream. Since these were different streams, the element only had a stream with a video track and audio was never played out or decoded.
See here for a fiddle reproducing the issue.
Over time, when working with this events log, you learn to see the patterns.
How can we help

WebRTC statistics is an important part of developing and maintaining WebRTC applications. We’re here to help.
You can check out my products and services on the menu at the top of this page.
The two immediate services that come to mind?
- WebRTC Courses – looking to upskill yourself or your team with WebRTC knowledge and experience? You’ll find no better place than my WebRTC training courses. So go check them out
- WebRTC Insights – once in every two weeks we send out a newsletter to our Insights subscribers with everything they need to know about WebRTC. This includes things like important bugs found (and fixed?) in browsers. This has been a lifesaver more than once to our subscribers
Something else is bugging you with WebRTC? Just reach out to me.