
Troubleshoot your WebRTC applications with proven strategies. Discover tools to resolve common issues in connectivity and performance.
WebRTC is great. When it works.
When it doesn’t? A bit less so. Which is why there are tools available at your disposal to be able to debug and troubleshoot issues with your WebRTC application - be it connectivity failures, poor quality, bad use of the APIs or just buggy implementation.
This article, as well as the other articles in this series were written with the assistance of Philipp Hancke.
Interested in webrtc-internals and getStats? Then this series of articles is just for you:
- webrtc-internals and getStats
- Reading getStats in WebRTC
- ICE candidates and active connections in WebRTC
- WebRTC API and events trace
- Tools for troubleshooting WebRTC applications (you are here)
Time to get down to business and see what tools are available to us for troubleshooting WebRTC applications.
The need for observability in WebRTC

People approach me frequently to help them find issues with their applications. They are stuck being unable to launch a WebRTC service or get too many customer complaints about the service instability.
The complaints are varied. They come in different shapes and sizes:
- Too many calls don’t connect
- Some calls have poor quality
- Users complain our service isn’t as good as Zoom (or other providers)
- A few if the participants can hear others in a group conference
There’s usually more than a single reason to cause each of the problems, which means the original complaint isn’t enough to solve the root cause of the problem.
For that, what is needed is observability in WebRTC. The ability to collect and analyze the relevant information in such calls that have issues. And for that, you need the system and the tooling in place.
The best approach if you ask me? Getting as close as possible to what webrtc-internals has to offer, and then outdo that as well.
What I want to do in this article, is to list a few of the solutions out there available today.
Analyzing webrtc-internals (and getStats) with fippo’s dump importer

The first tool on this list is fippo’s dump importer.
You take a webrtc-internals dump file, upload it to the dump importer, and then get a nice visualization of it.
We’ve covered this tool already in this series of articles, so there’s no point doing it here again.
The cool thing? It also supports files that get collected using rtcstats, which is the next tool on this list.
Using rtcstats for WebRTC data collection

What you get with fippo’s dump importer is great, but then you need to collect a webrtc-internals dump from an incident to be able to use it, and chrome://webrtc-internals is a technician’s solution to the problem, which means it can’t scale to production systems and real users.
Which is why we need to be able to collect that data on our own from the WebRTC calls in our application. To do that, you can use rtcstats. This is another open source project that can help in collecting the relevant data inside your client side JS code that runs in the browser. It will collect data similar to webrtc-internals and allows you to send them to a server using a way you choose. One way to do this is to send the data via WebSockets while the call is running. This may have a slight performance impact on the call but means the data is available immediately after the call ends.
Another alternative is to collect the data locally and upload a blob after the call ends. This avoids taking bandwidth from a live call but you need to consider what happens if a user closes the tab and never returns. This might still be useful if you only want to have the data available when the user files a support request in which case it can be uploaded as part of that.
For native applications, you might want to port this code as well, though that’s a bit more challenging. Jitsi is maintaining a friendly fork of the project.
Full fledged getStats based monitoring

rtcstats is the client side for WebRTC data collection. It comes without a server side - it just generates the JSON blobs you need to collect somewhere.
While unmaintained rtcstats-server (Jitsi maintains a fork for this too), it shows a couple of things you can do with the data and can serve as a starting point. The concept is to send the stats over a WebSocket to a server, and have that server process it at the scale you need. One of the most basic functionalities provided is taking the data and storing it to a file which then gets uploaded to a cloud storage service. A way more fancy feature is to extract certain metrics from each session, such as the time it takes getUserMedia to resolve, and look at those metrics over all calls on your service.
One thing to remember - be sure to store the files in their rtcstats format (which is basically line-oriented JSON), so that you’ll be able to view them with fippo’s dump importer 😉
observeRTC
Then there’s observeRTC. An open source project that includes the client side and the server side.
It isn’t that popular, but it has many of the bits and pieces needed.
Check it out as well when you plan on building your own.
peer metrics
peer metrics is/was a commercial SaaS service for monitoring WebRTC. A year ago, they open sourced it. The open source projects themselves aren’t that popular at the moment and the amount of work done on this service is minimal.
Again, check it out if you are planning to build your own.
testRTC
If you are looking for a client side WebRTC data collection service that works at scale commercially, then there’s Cyara watchRTC. Cyara acquired Spearline which acquired testRTC.
testRTC was a company I co-founded with a couple of friends. You can say I am biased as to what this service can do.
If you want an out of the box solution - check them out.
rtcStats
I am one of the people behind rtcStats. It is a combination of open source and commercial offering, that offers the best visualization and WebRTC troubleshooting capabilities on the market today.
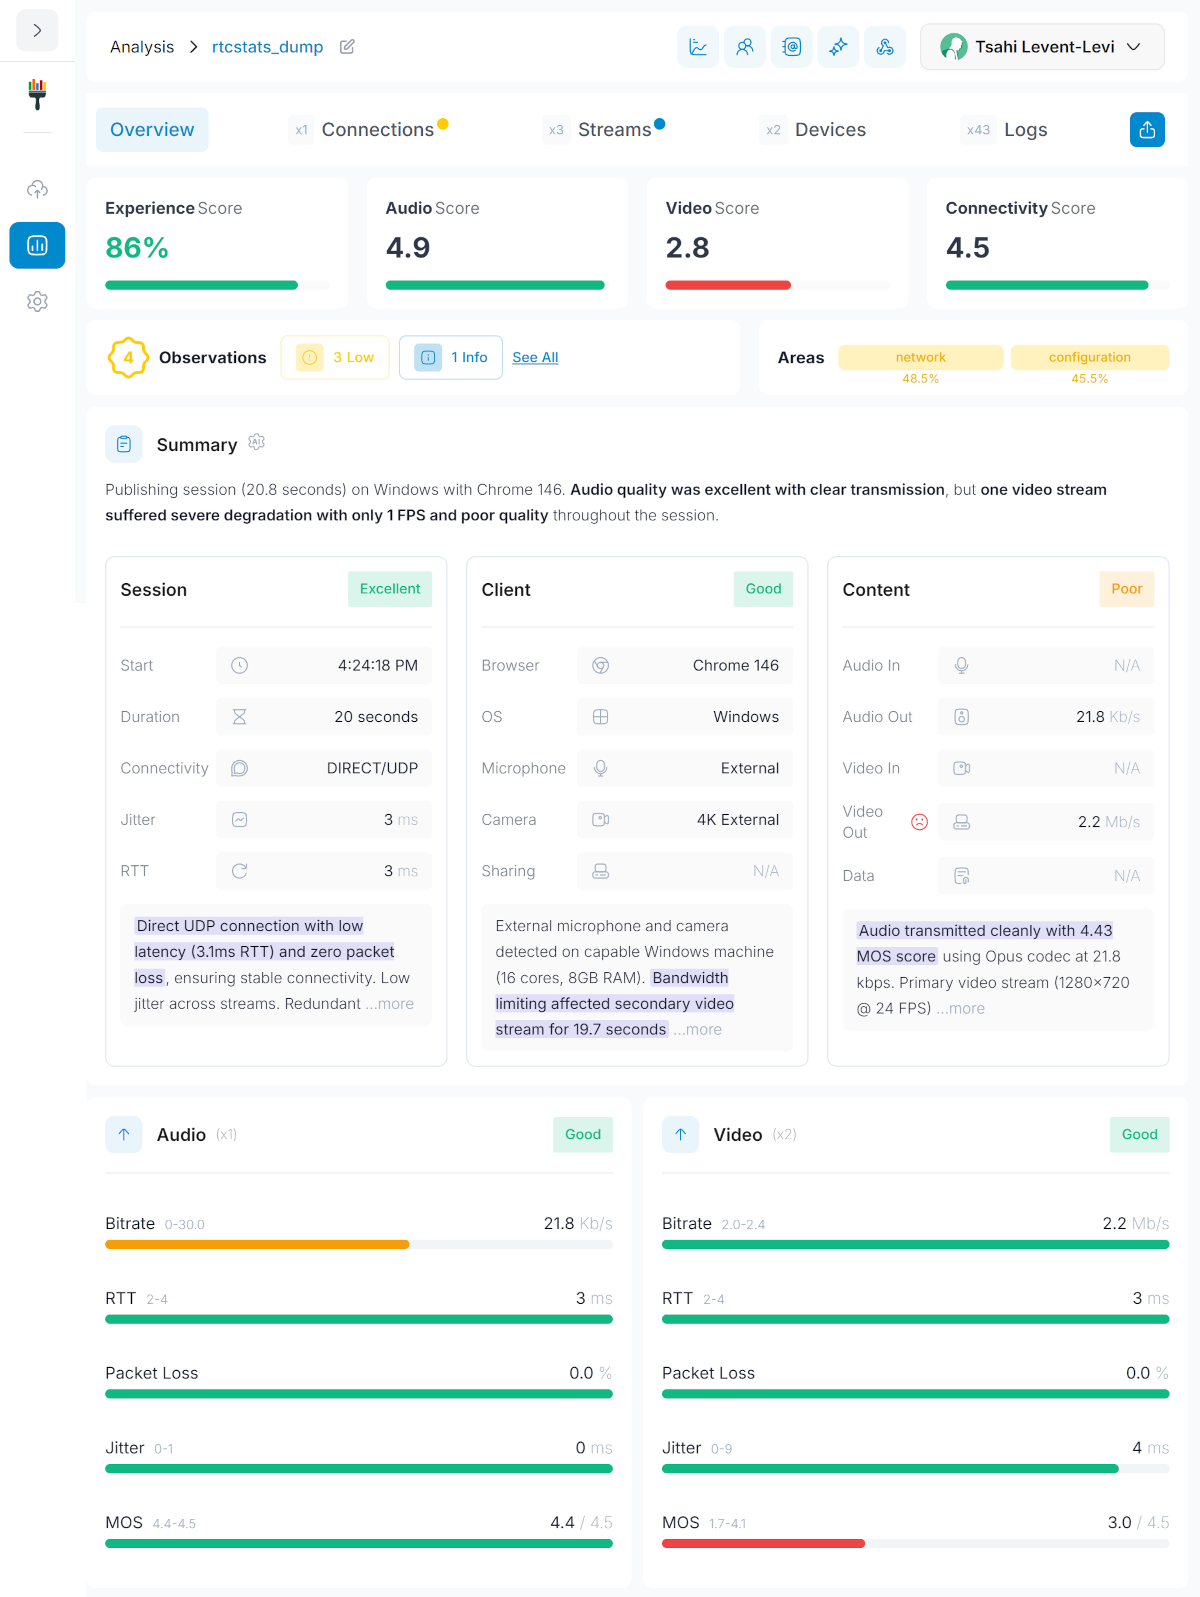
It enables you to deploy your own monitoring and observability on top of a rock solid open source foundation, empowering you to both own your data and decide what to display in your dashboards - complete flexibility.
Check us out 👉 rtcstats.com
How can we help

WebRTC statistics is an important part of developing and maintaining WebRTC applications. We’re here to help.
You can check out my products and services on the menu at the top of this page.
The immediate services that come to mind?
- rtcStats - meant to offer the best troubleshooting and debugging solution for WebRTC applications out there
- WebRTC Courses - looking to upskill yourself or your team with WebRTC knowledge and experience? You’ll find no better place than my WebRTC training courses. So go check them out
- WebRTC Insights - once in every two weeks we send out a newsletter to our Insights subscribers with everything they need to know about WebRTC. This includes things like important bugs found (and fixed?) in browsers. This has been a lifesaver more than once to our subscribers
Something else is bugging you with WebRTC? Just reach out to me.