
Monitoring focus is shifting from server-side to client-side in WebRTC statistics collection.
WebRTC happens to decentralize everything when it comes to VoIP. We’re on a journey here to shift the weight from the backend to the edge devices. While the technology in WebRTC isn’t any different than most other VoIP solutions, the way we end up using it and architecting our services around it is vastly different.
One of the prime examples here is how we shifted focus for group calling from an MCU mixing model to an SFU routing model. Suddenly, almost overnight, the notion of deploying MCU started to seem ridiculous. And believe me - I should know - I worked at a company where %60+ came from MCUs.
The shift towards SFU means we’re leaning more on the capabilities and performance of the edge device, giving it more power in the interaction when it comes to how to layout the display, instead of doing all the heavy lifting in the backend using an MCU. The next step here will be to build mesh networks, though I can’t see that future materializing any time soon.
VoIP != WebRTC. Maybe not from a direct technical point, but definitely from how we end up using it. If you need to learn more about WebRTC, then my WebRTC training is exactly what you need:
What I wanted to mention here is something else that is happening, playing towards the same trend exactly - we are moving the collection of VoIP performance statistics (or more accurately WebRTC statistics) from the backend to the edge - we now prefer doing it directly from the browser/device.
VoIP Statistics Collection and Monitoring
If you are not familiar with VoIP statistics collecting and monitoring, then here’s a quick explainer for you:
VoIP is built out of the notion of interoperability. Developers build their products and then test it against the spec and in interoperability events. Then those deploying them integrate, install and run a service. Sometimes this ends up by using a single vendor, but more often than not, multiple vendor products run in the same deployment.
There is no real specification or standard to how monitoring needs to happen or what kind of statistics can, should or is collected. There are a few means of collecting that data, and one of the most common approaches is by employing HEP/EEP. As the specification states:
The Extensible Encapsulation protocol (“EEP”) provides a method to duplicate an IP datagram to a collector by encapsulating the original datagram and its relative header properties (as payload, in form of concatenated chunks) within a new IP datagram transmitted over UDP/TCP/SCTP connections for remote collection. Encapsulation allows for the original content to be transmitted without altering the original IP datagram and header contents and provides flexible allocation of additional chunks containing additional arbitrary data. The method is NOT designed or intended for “tunneling” of IP datagrams over network segments, and best serves as vector for passive duplication of packets intended for remote or centralized collection and long term storage and analysis.
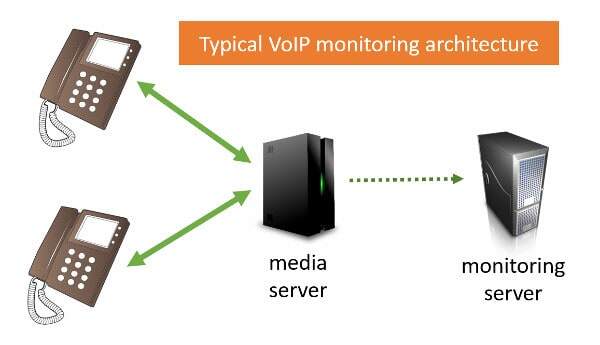
Translating this to plain English: media packets are duplicated for the purpose of sending them off to be analyzed via a monitoring service.
The duplication of the packets happens in the backend, through the different media servers that can be found in a VoIP network. Here’s how it is depicted on HOMER/SIPCAPTURE’s website:
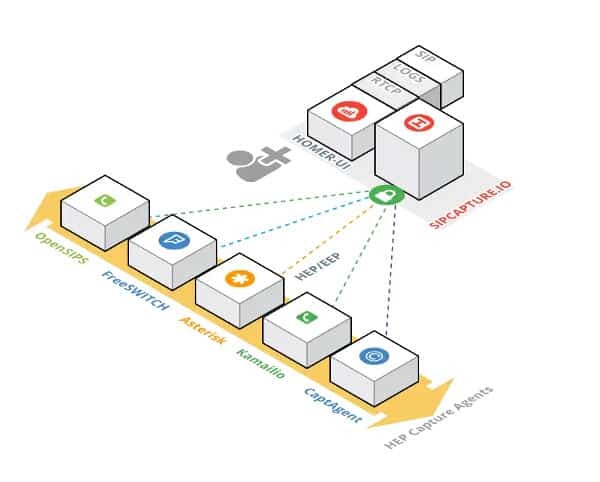
HOMER collects its data directly from the servers - OpenSIPS, FreeSWITCH, Asterisk, Kamailio - there’s no user devices here - just backend servers.
Other systems rely on the switches, routers and network devices that again reside in the backend infrastructure. Since in VoIP production networks, we almost always route the media through the backend servers, the assumption is that it is easier to collect it here where we have more control than from the devices.
This works great, but not really needed or helpful with WebRTC.
WebRTC Statistics Collection and Monitoring
With WebRTC, there are only a handful of browsers (4 to be exact), and they all adhere to the same API (that would be WebRTC). And they all have that thing called getstats() implemented in them. These get the same information you find in chrome://webrtc-internals.
Many deployments end up running peer-to-peer, having the media traverse directly through the internet and not through the backend of the service itself. Google Hangouts decided to take that route two years ago. Jitsi added this capability under the name Jitsi P2P4121. How do these services control and understand the quality of their users?
If you look at other media servers out there, most of them are a few years old only. WebRTC is just 6 years old now. So everyone’s focused on features and stability right now. Quality and monitoring is not in their focus area just yet.
Last, but not least, WebRTC is encrypted. Always. And everywhere. So sniffing packets and deducing quality from them isn’t that easy or accurate any longer.
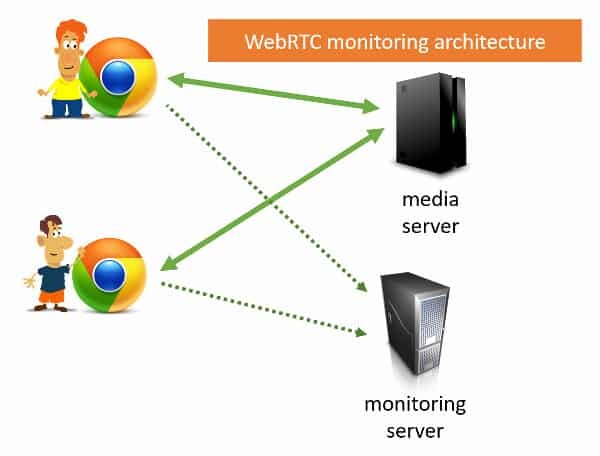
This led to the focus of WebRTC applications in gathering WebRTC statistics from the browsers and devices directly, and not trying to get that information from the media servers.
The end result? Open source projects such as rtcstats with its commercial SaaS offering rtcstats.com. At the heart of these, WebRTC statistics gets collected using the getstats() API at an interval of one or more seconds, sent over to a monitoring server, where it is collected, stored, aggregated and analyzed.
What does that give us?
- The most accurate indication of performance for the end user - since the statistics are collected directly on the user’s device, there’s no loss of information from backend collection
- Easy access to the information - there’s a uniform means of data collection here taking place. One you can also implement inside native mobile and desktop apps that use WebRTC
- Increased reliance on the edge, a trend we see everywhere with WebRTC anyway
What’s Next?
WebRTC chances a lot of things when it comes to how we think and architect VoIP networks. The part of how and why this is done on statistics and monitoring is something I haven’t seen discussed much, so I wanted to share it here.
The reason for that is threefold:
- Someone asked me a similar question on my contact page in the last couple of days, so it made sense to write a longform answer as well
- We’re contemplating at testRTC offering a passive monitoring product to use “on premise”. If you want to collect, store and analyze your own WebRTC statistics without giving it to any third party cloud service, then ping us at rtcstats.com
- My online WebRTC training is getting a refresher and a new round of office hours. This all starts in April. Time to enroll if you want to educate yourself on WebRTC