Unlock the potential of WebRTC stats with getStats to boost your application’s performance and reliability.

WebRTC is great. When it works.
When it doesn’t? A bit less so. Which is why there are tools available at your disposal to be able to debug and troubleshoot issues with your WebRTC application – be it connectivity failures, poor quality, bad use of the APIs or just buggy implementation.
This article, as well as the other articles in this series were written with the assistance of Philipp Hancke.
Interested in webrtc-internals and getStats? Then this series of articles is just for you:
- webrtc-internals and getStats
- Reading getStats in WebRTC (you are here)
- ICE candidates and active connections in WebRTC
- WebRTC API and events trace
- Tools for troubleshooting WebRTC applications
This time? We’re taking a closer look at what’s inside getStats values – what the metrics that you’ll find there really mean (at least the more important ones)
Table of contents
- webrtc-internals / getStats
- Structure of a getStats returned value
- Different objects same fields?
- A deep dive into getStats values
- Fields and value types
- “transport” type
- “candidate-pair”, “local-candidate” and “remote-candidate” types
- RTCRtpStreamStats
- RTCSentRtpStreamStats and RTCReceivedRtpStreamStats
- “outbound-rtp” and “remote-inbound-rtp” types
- “inbound-rtp” and “remote-outbound-rtp” types
- “codec” type
- “media-source” type
- “media-playout” type
- Others? “peer-connection”, “data-channel” and “certificate” types
- Structure of a webrtc-internals file
- How can we help
webrtc-internals / getStats

We’re going to use these two terms interchangeably from now on, so please bear with us.
For me?
- getStats is the API inside WebRTC that collects a lot of the data and metrics we’ll look at
- webrtc-internals is what Chromium gives us as the main debugging tool for WebRTC (and a lot of the data in there? That’s getStats data)
- And then rtcstats.com is how I visualize this data to reduce the time to troubleshoot from hours to minutes…
If you’ve read the previous article, then you should know by now how to obtain a webrtc-internals dump file and also how to call getStats periodically to get the statistics you need.
So time to understand what’s in there…
Structure of a getStats returned value

There are many metrics that can be used in WebRTC to monitor various aspects of the peer connection. To put some sense and order into the process, the W3C decided to design the getStats() API in a manner that would “flatten” the information out for easy search access, and also include identifiers to be able to think of it all as structured tree data.
Here’s a “short” video explainer for WebRTC getStats() result structure:
A map of stats objects
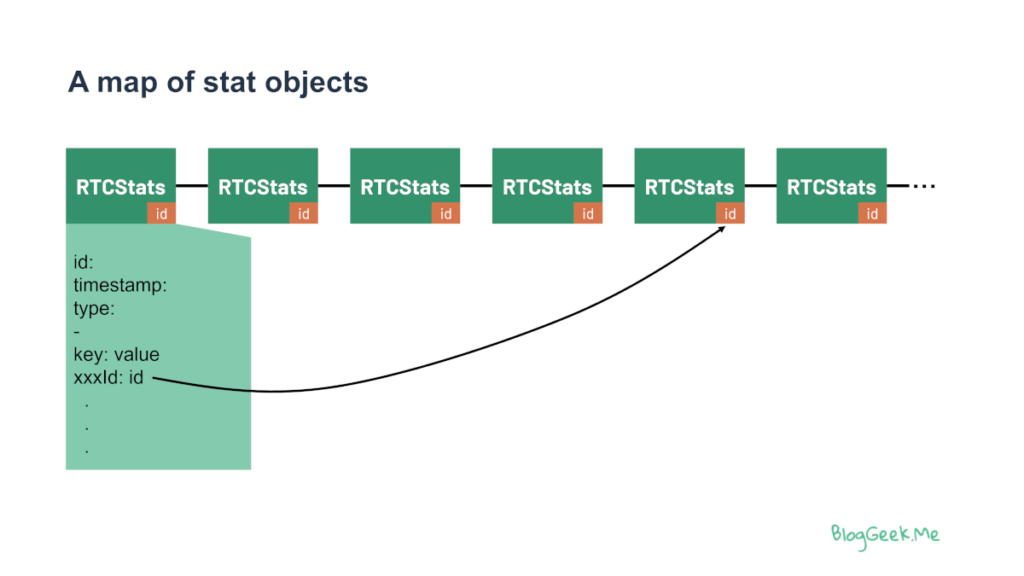
WebRTC has been broken down in the specification to various objects for the purpose of statistics reporting. These objects are sometimes singletons (such as the “peer-connection”) and sometimes may have multiple instances (think incoming media streams).
To get away from the need of maintaining multiple arrays, a single map of statistics is used which stores in it as a set of RTCStats objects.
Each RTCStats object always has in it an id (object identifier), a timestamp and a type. The rest of the fields (and values) stored in the object depend on the type.
Multiple objects of the same type, such as “inbound-rtp” will have a different id.
Here’s how it looks like if you inspect the response object in the JS console on Chrome:
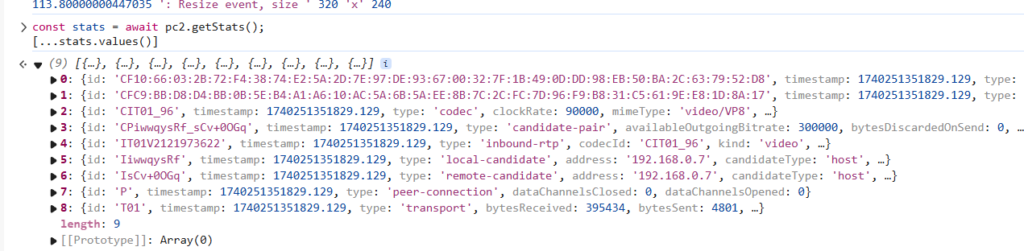
Partial getStats
Before we dive into the hierarchy and the metrics, it is important to note what happens with getStats() when you call it with a specific selector. The selector is a specific MediaStreamTrack, so that the results returned are going to be limited to that track only.
getStats()
getStats(selector)
RTCRtpSender.getStats()
RTCRtpReceiver.getStats()
Great – right?
Not really…
This is not going to help you in any way, but in many ways, it is a hindrance.
When calling getStats(), with or without a selector, libWebRTC goes about its business collecting the statistics across ALL of the WebRTC objects. It sweats and uses resources to collect everything, and then filter down the results for you. There’s no optimization in the collection process that is taking place here.
Since you’re usually going to need to check statistics across your tracks, calling this separately for each track is wasteful.
Our suggestion? Always call getStats() with no selector at all. Do the filtering yourself if needed.
Hierarchy of objects

Most objects in getStats (but not all of them) end up connecting in one way or another to the “transport” object.
This “hidden” tree structure can be reconstructed by way of the various id fields found inside WebRTC’s stats objects (from WebRTC stats spec):
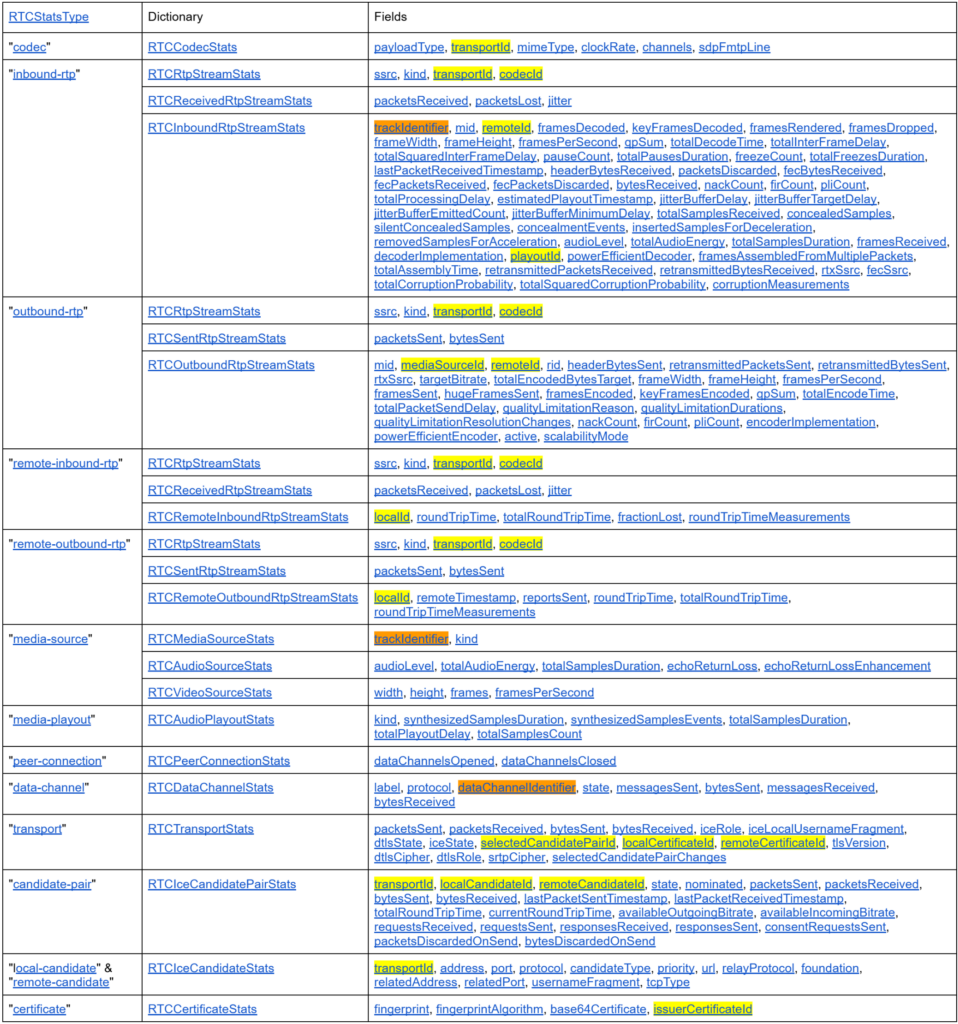
Some important notes about this table:
- We’ve taken the liberty of marking in yellow all of the internal pointers, which can be used to easily jump from one RTCStats object to another inside the results object. All of these end with “Id”
- We also marked in orange the track and data channel identifiers. These relate to internal identifiers of WebRTC objects – they can’t be used as stats pointers
- Oh, and there are more fields than what you see here… two reasons why:
- The spec has more of them. This table may change as the standard evolves and should be considered partial at best (so click through in the specification to the RTCxxxStats objects to get the full details and descriptions
- Chrome, as well as other browsers, may have their own proprietary fields that they’ve added where they saw fit. Why? Because they can
Let’s see what the main stats objects and fields are there.
The specification of these can be found in the W3C spec for WebRTC itself.
There’s also an extensive knowledge base that covers all WebRTC metrics – check it out.
Different objects same fields?
In some cases, you may find fields with the same name on different objects. That’s true for things like bytesSent, bytesReceived, packetsSent and packetsReceived.
The thing is, if they are on different objects – they have slightly different meaning. Or more like a similar meaning, but counting slightly different things.
Here’s a quick video explainer:
A deep dive into getStats values

Time to look at getStats objects and fields and understand what values we may get for certain WebRTC metrics.
Fields and value types
For me, all of these fields are just field:value (or key:value) pairs.
If I had to group the fields to the types of values they store, it would be something like this:
- Identifiers – values that are used to link one stats object to another (we have a screenshot above with yellow markings for all these). Their names end with “Id”. Beware, “trackIdentifier” is not such a pointer
- verbose/textual – these are values that store textual or verbose information. Not something that we plot on a graph
- accumulators – these are metrics that grow over time, accumulating their information. For example, the number of packets lost (since the beginning)
- calculated – the calculated metrics don’t exist in getStats(). getStats doesn’t have calculated values since it takes no stance on the interval over which to calculate averages. These reside in webrtc-internals, which places their names inside [] brackets. They take accumulators and divide them by “something” – usually seconds, to get them averaged out over short periods of time, making it easier to spot outliers on graphs
- numbers – numeric values of various kinds that aren’t accumulators or calculated. They are just… numbers. They are either static most of the time, change a bit or change a lot throughout the session. An example? The audio level on the incoming audio or height (in pixels) of a video stream
Why did I want to mention all this? When you see a field, be sure to think about its type – it will help you determine how to read it and what you should do with it.
“transport” type
👉 Link to spec (RTCTransportStats)
The “transport” type denotes the DTLS and ICE transport objects used to send and receive media. You can think about it as a single RTP/RTCP “connection”.
Things you’ll find on the “transport” type?
- Accumulators for packets and bytes sent and received (these are packetsSent, packetsReceived, bytesSent and bytesReceived). This is totals and on a high level. You’ll be more interested in the lower level values on other objects most of the type
- Status and state of DTLS and ICE objects, which is important for debugging (mainly iceRole, dtlsState, iceState and dtlsRole)
- The selected ICE candidate pair identifier – selectedCandidatePairId, which is important to understand where we’re connected to and how exactly (UDP, TCP, direct, relay, etc)
- The certificate identifiers – localCertificateId and remoteCertificateId – not much use in them
Typically you will have a single transport object per connection (unless you are not using BUNDLE).
“candidate-pair”, “local-candidate” and “remote-candidate” types
These objects deal with ICE negotiation candidates.
During this process, WebRTC collects all local candidates (IP addresses it can use to receive media and send media from) and the remote candidates (IP addresses that the remote peer tells him he can be reached out at). WebRTC then conducts ICE connectivity checks by pairing different local candidates with remote candidates.
To that end, getStats stores and returns us all “local-candidate” and “remote-candidate” types along with the “candidate-pair” types for the pairs it tried out.
“local-candidate” and “remote-candidate”?
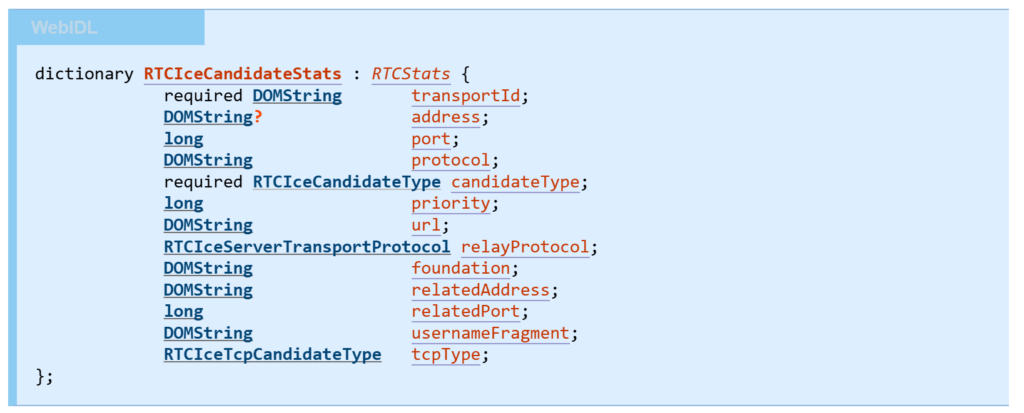
👉 Link to spec (RTCIceCandidateStats)
The ICE candidate statistics object stores static information in general. It doesn’t have anything that changes dynamically, as that happens on the pair. The main fields here relate to the IP, port and protocol (address, port, protocol, candidateType and relayProtocol) used by the candidate.
Our “candidate-pair”?
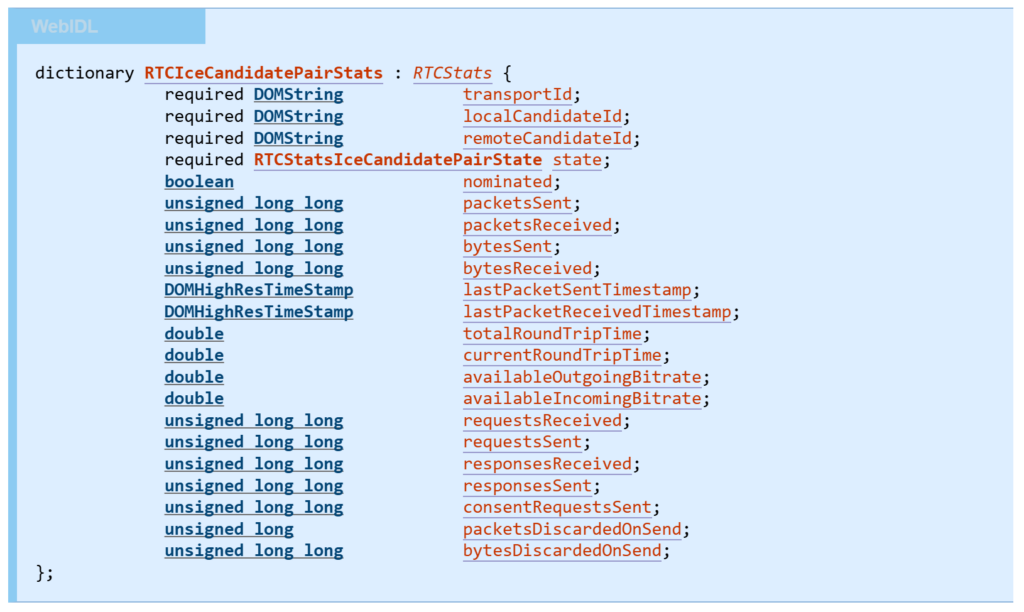
👉 Link to spec (RTCIceCandidatePairStats)
The candidate pair is the actual connection (or attempted connection). Here things start to become interesting (at last).
On one hand, the pair contains quite a few identifiers, connecting it to the transport object (transportId) and to the local and remote candidates (localCandidateId and remoteCandidateId). The state field indicates when ICE checked it, failed or succeeded (not too useful).
There are quite a few interesting fields here:
- packetsSent, packetsReceived, bytesSent and bytesReceived. These are similar in nature to the ones found on the “transport” type, but for the specific candidate pair
- On top of these we have additional accumulators – requestsReceived, requestsSent, responseReceived, responseSent and consentRequestsSent – all of these relate to the ICE protocol and connectivity checks conducted for this pair. This becomes important when your connection does not go through
- We’ve got timestamps, indicating when packets were last sent or received
- Round trip calculations for the STUN/TURN connection (not necessarily what we want as RTT, but sometimes all we’ve got to go with – these measure the ICE RTT – towards the peer that terminates ICE which might be a SFU, which is different from what RTCP RTT measures). These are the totalRoundTripTime and currentRoundTripTime
- Bandwidth estimation calculated values in availableOutgoingBitrate and availableIncomingBitrate
- Then there’s packetsDiscardedOnSend and bytesDiscardedOnSend, both accumulators that may indicate network or compute issues (read more about discarded WebRTC packets)
👉 For the most part? This section still deals with connectivity related metrics. A lot less about quality itself.
RTCRtpStreamStats
We’re getting to fragmented stats structures – think classes and inheritance in object oriented programming languages. The RCTRtpStreamStats take part of all rtp reports – “outbound-rtp”, “inbound-rtp”, “remote-inbound-rtp” and “remote-outbound-rtp”. What does it hold?
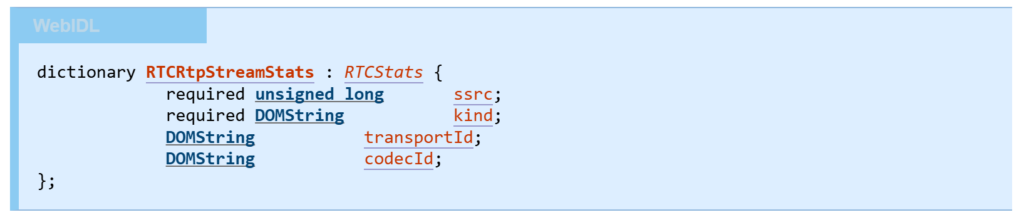
👉 Link to spec (RTCRtpStreamStats)
ssrc is the static field connecting us to the SSRC value of the RTP stream itself. These reports also aggregate data from SSRCs related to this SSRC such as the RTX and FEC SSRCs.
kind just indicates if this is a “voice” or a “video” stream. That’s going to affect other metrics down the line, and is also a way to filter and find what we’re looking for.
Then we’ve got the pointer identifiers transportId and codecId.
Nothing much to write home about here, but important to know and understand nonetheless.
RTCSentRtpStreamStats and RTCReceivedRtpStreamStats
Each “*-rtp” type object also holds in it either an RTCSentRtpStreamStats or an RTCReceivedRtpStreamStats set of fields.
RTCSentRtpStreamStats
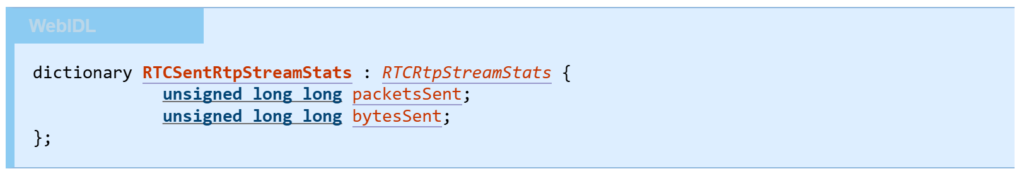
👉 Link to spec (RTCSentRtpStreamStats)
The Sent one is rather simple. It holds two accumulators that we’ve seen already: packetsSent and bytesSent.
There’s slightly more (and different) fields in the receive side of things:
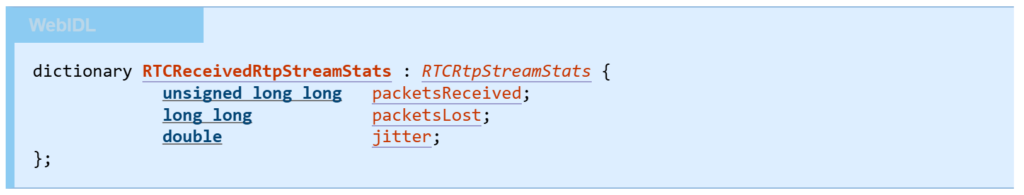
👉 Link to spec (RTCReceivedRtpStreamStats)
On the receiving end, we’re focused on two accumulators and a variable metric. The accumulators are packetsReceived and packetsLost (rather important ones that also help us in calculating packet loss percentage).
And then there’s the jitter metric, which is the reported jitter of the incoming stream’s packets.
“outbound-rtp” and “remote-inbound-rtp” types
These two types are about outgoing media. “outbound-rtp” is about what we send and “remote-inbound-rtp” is about what our peer reported it received from us.
Each of these holds more than one stats object inside of it. We’ve covered the basics of these objects above. Time to look at what they specifically hold.
Let’s review each one of them separately.
“outbound-rtp”
outbound-rtp reports back to us what our WebRTC implementation is sending on a stream. To begin with, the “outbound-rtp” stats object will be holding RTCRtpStreamStats and RTCSentRtpStreamStats fields.
On top of it, there’s a slew of additional fields that will be there, depending on the type of the stream – audio or video.
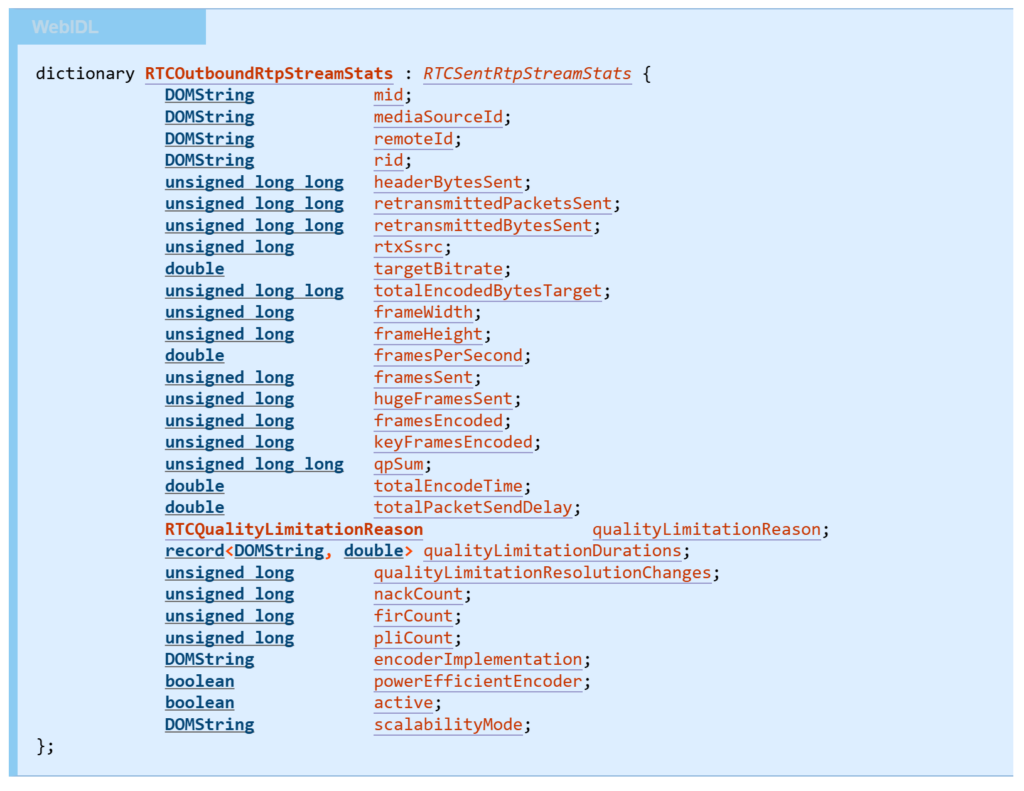
👉 Link to spec (RTCOutboundRtpStreamStats)
Our outbound RTP metrics relate to both audio and video, with specific metrics that are relevant only for video.
Both audio and video:
- mid and rid values, if existent and relevant. The mid tells you where in the SDP the media associated with these stats lives, the rid tells you which simulcast layer is described by it.You won’t be needing this much for quality measurements
- rtxSsrc for the retransmission SSRC, if one is used
- mediaSourceId and remoteId are again identifier indexes. The remoteId points to the relevant “remote-inbound-rtp” object described below
- Lots of accumulators: headerBytesSent, retransmittedPacketsSent, rentransmittedBytesSent, totalPacketSendDelay and nackCount
- We’ve got our targetBitrate indicating what the encoder is compressing towards
- Active indicates if this is an active stream or not
Video only:
- Additional accumulators here include totalEncodedBytesTarget (which is currently broken and may get removed from the specification), framesSent, hugeFramesSent, keyFramesEncoded, qpSum, firCount, pliCount and totalEncodeTime
- pliCount and firCount give you an idea how often the encoder needs to produce “expensive” keyframe
- totalEncodeTime can be divided by framesEncoded gives you an idea how much time the encoder is spending per frame on average – the upper limit for that is 33ms for 30fps
- We can figure out the video resolution we’re sending by looking at frameWidth and frameHeight
- And we’ve got framesPerSecond on top of framesSent so we don’t have to calculate fps directly (at least not for the simple scenarios)
- Using SVC or Simulcast with temporal scalability? scalabilityMode is going to be a relevant metric to understand what layers are being encoded
- qualityLimitationReason, qualityLimitationDurations, qualityLimitationResolutionChanges are unique in their structure and use. Suffice to say that we’ve done a fiddle about this one: Quality limitation stats in WebRTC
- encoderImplementation is a static value that hints on the actual codec implementation (software or hardware). To that end, powerEfficientEncoder is also useful if available. These won’t always be available to you (some browsers restrict this due to privacy reasons)
Now that we have what we “know” we sent, time to look at “remote-inbound-rtp”
“remote-inbound-rtp”
The remote-inbound-rtp object is all about what the remote side reported back about our sent stream. In essence, this is the RTCP RR (Receiver Report) data – or more accurately – parts of it. Our “remote-inbound-rtp” stats object also holds RTCRtpStreamStats and RTCReceivedRtpStreamStats fields.
👉 Link to spec (RTCRemoteInboundRtpStreamStats)
- We have the customary localId identifier connecting us back to “outbound-rtp”
- totalRoundTripTime and roundTripTimeMeasurements are both accumulators, together hinting on the average RTT
- roundTripTime as most recently calculated
- fractionLost is the packet loss percentage
Time to talk about the “other side”…
“inbound-rtp” and “remote-outbound-rtp” types
What we had for outbound is there for inbound as well. “Inbound-rtp” is what we actually received and processed while “remote-outbound-rtp” is what the remote peer reported to us it sent (where some might have gotten lost in the void of the internet).
Here’s what we have for the “inbound-rtp” – RTCRtpStreamStats, RTCReceivedRtpStreamStats as well as additional fields:
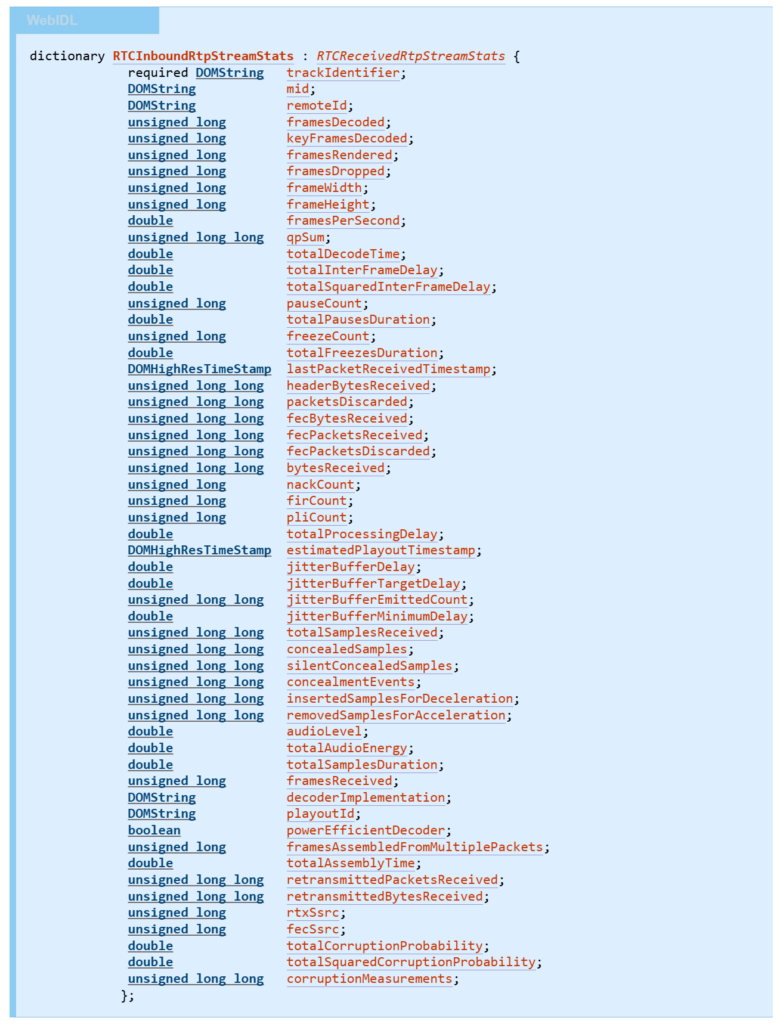
👉 Link to spec (RTCInboundRtpStreamStats)
For inbound RTP related stats, we have those that are specific to audio, those specific to video and those that relate to both.
Both audio and video:
- trackIdentifier, connecting us to the media track
- mid value, if existent and relevant. The mid tells you where in the SDP the media associated with these stats lives. You won’t be needing this much for quality measurements
- rtxSsrc and fecSsrc for the retransmission SSRC, if one is used. fecSsrc is set when receiving video FEC with a mechanism that uses a different SSRC like flexfec
- remoteId as an identifier index, pointing to the relevant “remote-outbound-rtp” object described below
- Lots of accumulators: headerBytesReceived, packetsDiscarded, fecBytesReceived, fecPacketsReceived, fecPacketsDiscarded, bytesReceived, totalProcessingDelay, nackCount, jitterBufferEmittedCount, retransmittedPacketsReceived and retransmittedBytesReceived
- Our bytesReceived accumulator also includes the RTX and FEC bytes. For the most part, you’ll need to subtract retransmittedBytesReceived and fecBytesReceived from it to get to the raw payload bytes (actual media, without the extra fluff)
- There are a few metrics (non-accumulators) that give us the status of the jitter buffer: jitterBufferDelay, jitterBufferTargetDelay, jitterBufferMinimumDelay. These allow you to estimate how much time packets or frames spend in the jitter buffer
- Then there are lastPacketReceivedTimestamp and estimatedPlayoutTimestamp values which you need to look at if you are wondering if you have not received data for a while
Audio only:
- There are audio specific accumulators dealing with packet loss concealment: totalSamplesReceived, concealedSamples, silentConcealedSamples, concealmentEvents, insertedSamplesForDeceleration and removedSamplesForAcceleration
- Of these we found concealedSamples and concealmentEvents somewhat useful metrics for how often the audio jitter buffer has to make up audio. Too often and too long and the user will notice
- We have two additional accumulators: totalSamplesDuration and totalAudioEnergy
- The audioLevel enables us to know the volume level of the incoming audio (note that this has its accumulator in totalAudioEnergy above)
- Then there’s playoutId, an identifier connecting us to the “media-playout” stats
Video only:
- Additional accumulators here include framesReceived, framesDecoded, keyFramesDecoded, framesRendered, framesDropped, qpSum, totalDecodeTime, totalInterFrameDelay, totalSquaredInterFrameDelay, pauseCount, totalPausesDuration, freezeCount, totalFreezesDuration, firCount, pliCount, framesAssembledFromMultiplePackets, totalAssemblyTime, totalCorruptionProbability, totalSquaredCorruptionProbability and the new corruptionMeasurements
- Of these, totalDecodeTime divided by framesDecoded is interesting for estimating CPU load
- The freezeCount tells you how often a video freeze was long enough to have been noticed by a user
- We can figure out the video resolution we’re receiving by looking at frameWidth and frameHeight
- And we’ve got framesPerSecond on top of framesReceived so we don’t have to calculate fps directly (at least not for the simple scenarios)
- decoderImplementation is a static value that hints on the actual codec implementation (software or hardware). To that end, powerEfficientDecoder is also useful if available
Now it is time to check what is being reported to use by the remote peer:
“remote-outbound-rtp”
The “remote-outbound-rtp” is what the remote peer tells us he sent us. This is received on our end by the RTCP SR (Sender Report) and then incorporated into this stats block.
As usual, it is comprised out of RTCRtpStreamStats, RTCSentRtpStreamStats and this additional block:
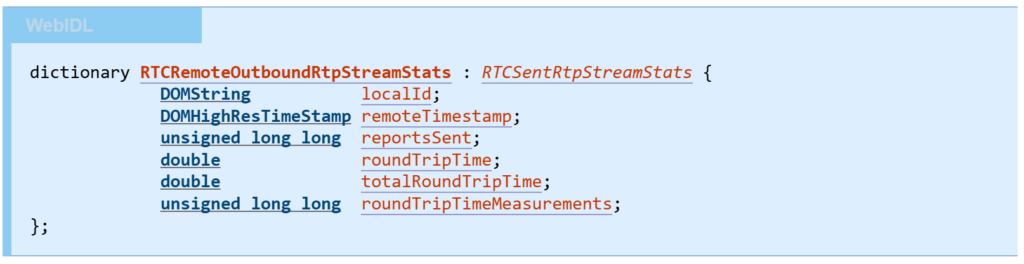
👉 Link to spec (RTCRemoteoutboundRtpStreamStats)
Here we have:
- The customary localId identifier connecting us back to “inbound-rtp”
- Accumulators for reportsSent, totalRoundTripTime and roundTripTimeMeasurements
- roundTripTime as most recently calculated (this and the relevant accumulators and fields only appear here if the relevant RTCP extension with the DLRR report block are implemented, which is still rather rare – more on that in our Low-Level WebRTC Protocols course)
“codec” type
The codec block holds information about the codec used – for both incoming and outgoing streams.
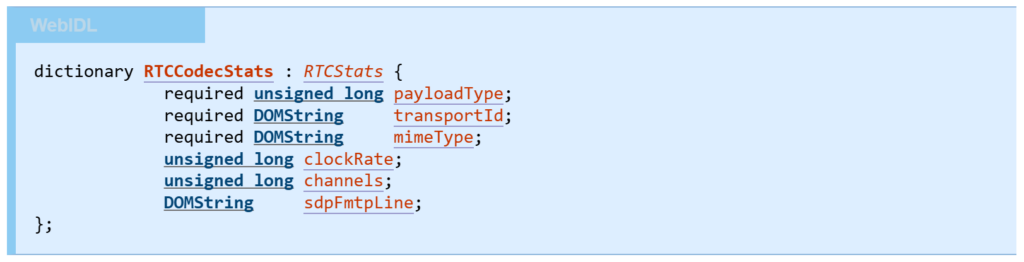
👉 Link to spec (RTCCodecStats)
Frankly? There’s not much here to use for monitoring… The best thing here is the ability to resolve a nice name for the codec.
“media-source” type
The “media-source” is about what we’re sending. It is split into 3 parts: generic, audio and video. Obviously, we will find either audio or video for any specific media source.
The generic
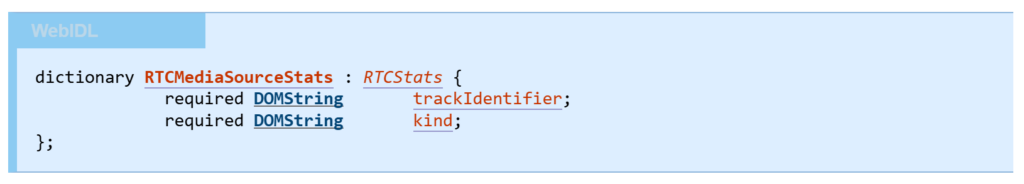
👉 Link to spec (RTCMediaSourceStats)
The kind field will indicate if we’re dealing with audio or video…
The audio
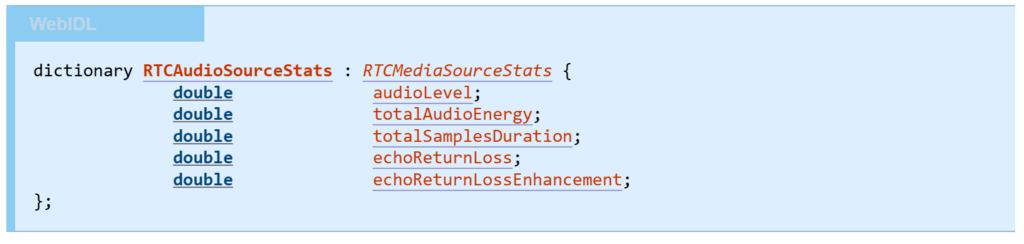
👉 Link to spec (RTCAudioSourceStats)
Here we have a few metrics, of which audioLevel is the most interesting:
- The audioLevel enables us to know the volume level of the captured audio
- For calculations of audio levels, we have two accumulators: totalAudioEnergy and totalSamplesDuration
- Then there are two additional metrics available for microphones that have built-in echo cancellation: echoReturnLoss and echoReturnLossEnhancement
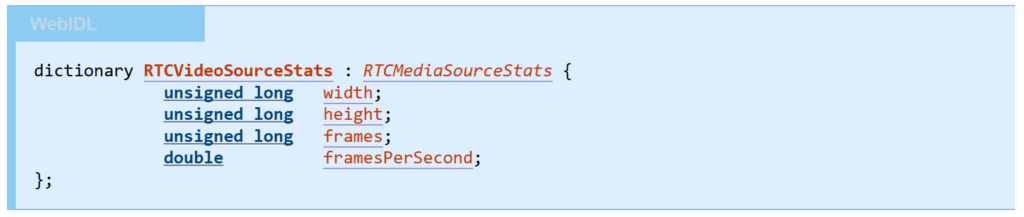
The video
👉 Link to spec (RTCVideoSourceStats)
We’ve seen the metrics here elsewhere as well – but this time, it indicates what our source video metrics are – not those measured just before encoding or after being decoded on the other end.
Towards that end, we have:
- width and height for the video’s resolution. This is what was captured on camera or screen. It might get scaled down before being sent or displayed on the other end, so it is a good reference to figure out the differences
- An accumulator of the number of frames captured so far
- Calculated FPS in the form of framesPerSecond. How is this calculation done and over what period of time? Not something specified or agreed upon
“media-playout” type
Where “media-source” is about outgoing streams, “media-playout” is about incoming ones. That said, today at least, “media-playout” is limited to audio streams only.
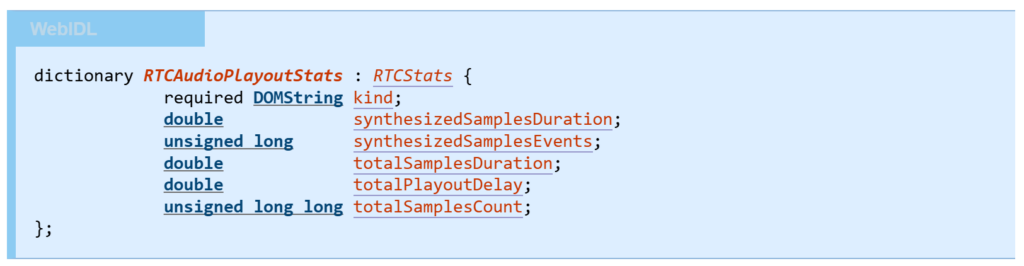
👉 Link to spec (RTCAudioPlayoutStats)
All of the fields here (besides the kind which is always set to “audio”) are accumulators.
Nothing much to add here.
Others? “peer-connection”, “data-channel” and “certificate” types
The other types of stats blocks don’t hold much in them. At least not in the form of something that is really useful when debugging.
The “peer-connection” has a running tally using accumulators for closed and opened data channels (dataChannelsOpened and dataChannelsClosed).
The “data-channel” one is built mostly of accumulators that can be calculated from sent and received data on the channels. Might be easier to take it from here, but it doesn’t add much value beyond being simpler to get in this manner.
And the “certificate”? Well… it just gives you that – the certificates trail. Not something we’ve used so far.
Structure of a webrtc-internals file

When it comes to chrome://webrtc-internals, the file itself is a simple JSON text file. The format is not specified and subject to change. It has grown historically and does some things like double-encoding as JSON.
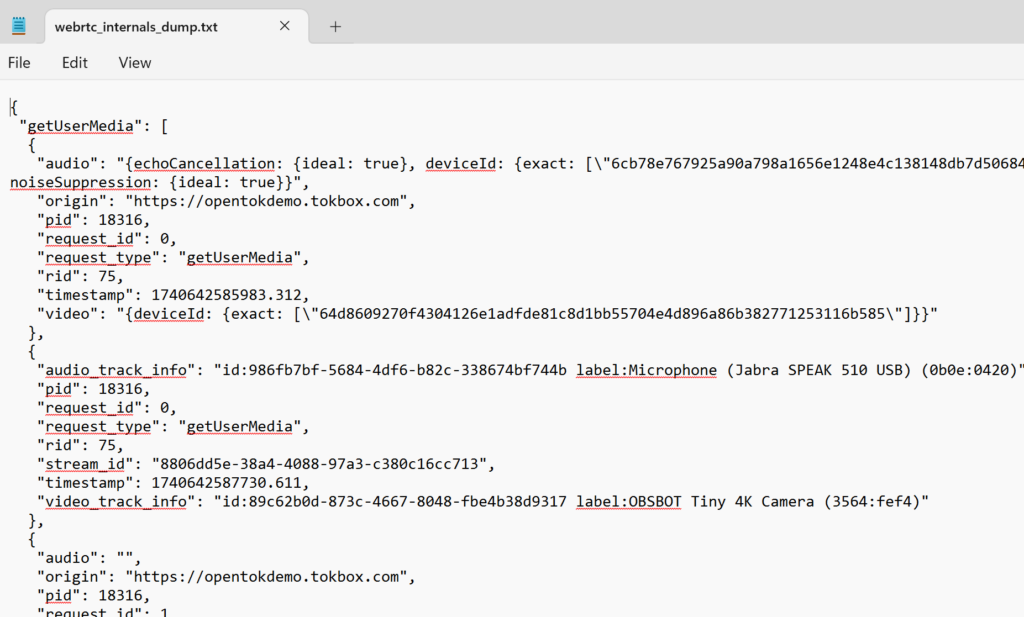
Sometimes you need to look at the format when you are looking for a specific value that is not visualized by your tooling such as the dtlsCipher.
If you open the content in a nice JSON viewer, you’ll get something like this:
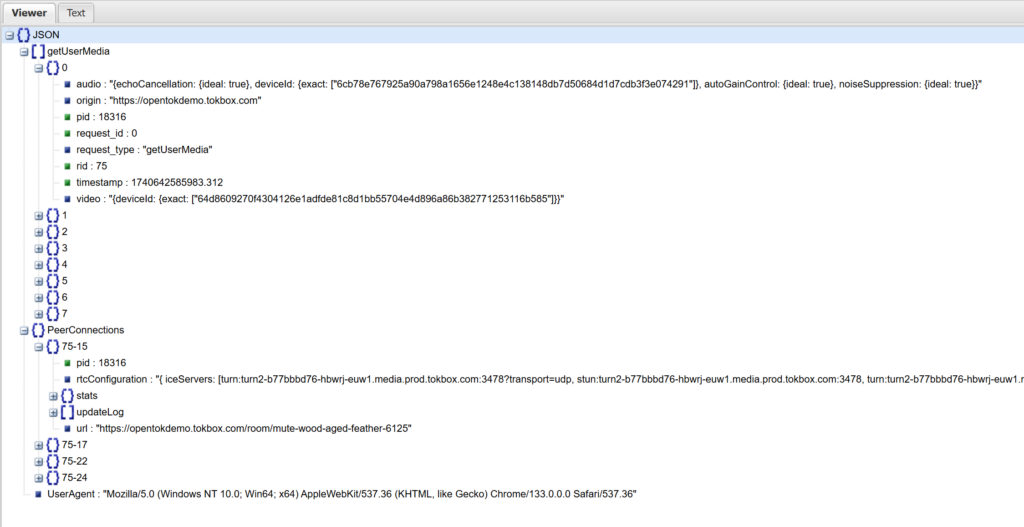
There are 2 arrays in this JSON file:
- getUserMedia, which shows the getUserMedia() and getDisplayMedia() API calls with their parameters and the resulting streams and tracks or errors
- List of PeerConnections objects, where each peer connection has its configuration, stats and updateLog
The stats inside the PeerConnections objects is an array of calls into getStats(). Here’s what you’ll find there:
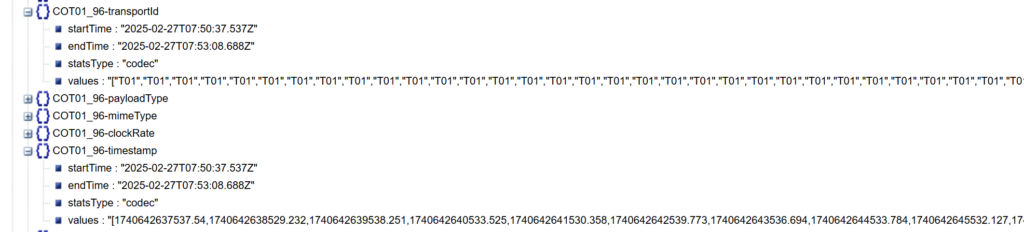
Here we see the id COT01_96. The field of each item is the postfix of the id – transportId, payloadType, mimeType, clockRate, timestamp, …
For each, we have the startTime and endTime, denoting the time the first and last samples were taken. We have the statsType – the object this is collected for (“codec” in this case). And the values which are an array of the values as taken over the period of time.
The eventsLog… that’s left for another article down the road.
If you are lazy, and you should be, then reading this file should be done using a dedicated visualizer. The open one out there is fippo’s WebRTC dump importer and the best one (and free) is rtcstats.com. They parse the structure and then visualize some of the data. I’ll leave it to you to try them out – they works great. Maybe we should do a video explainer for it at some point…
How can we help

WebRTC statistics is an important part of developing and maintaining WebRTC applications. We’re here to help.
You can check out my products and services on the menu at the top of this page.
The two immediate services that come to mind?
- WebRTC Courses – looking to upskill yourself or your team with WebRTC knowledge and experience? You’ll find no better place than my WebRTC training courses. So go check them out
- WebRTC Insights – once in every two weeks we send out a newsletter to our Insights subscribers with everything they need to know about WebRTC. This includes things like important bugs found (and fixed?) in browsers. This has been a lifesaver more than once to our subscribers
- rtcStats – if your on the lookout for the best open source debugging, troubleshooting and observability solution for WebRTC
Something else is bugging you with WebRTC? Just reach out to me.